Opened, Not Governed
Weaving Intelligence (House AI Style), with Jeff Shabel’s Experiential Commentary
A governance council meets and someone asks the question every council eventually asks: is it working? Not whether data is moving, which the platform’s own counts will tell you, but whether the programme is being adopted, whether the people who are supposed to steward the data are doing it. The question I was asked this week is what Profisee itself can tell you about that. Four signals get reached for first: stewards opening the tool, tasks closed inside their target duration, the age of the task queue, and the homepage metrics that arrived with the 2026 R3 release. Which of them does Profisee give you without building anything, which did I have to build outside it, and which would mislead a council that trusted it?
A disclosure, because what follows assesses Profisee. The practice behind this publication is a Profisee partner: clients pay us for deployment work, a licence sale we refer earns us a referral fee, our services revenue depends on master data management being bought at all, and we may offer the tooling we build to Profisee itself. Those interests run toward praise of Profisee, of the category and of Microsoft, whose Power BI I name below. One runs the other way: we build adoption and governance reporting for clients, which gives us a reason to say the product shows less on its own than it does. Discount that judgement too. The other products named below are named, not assessed, and the research is cited for what it says.
My answer, which I will take apart in the rest of the article:
Stock Profisee, out of the box, doesn’t provide a great deal of ‘usage metrics.’ That’s why the addition of the 2026R3 homepage metrics is such a significantly beneficial feature.
I will use two words the same way throughout. Flow is records moving through the platform: loaded, matched, merged, mastered. Adoption is people doing the governing work in it: stewards deciding, owners approving, tasks getting closed. A programme can have plenty of flow and no adoption, because loads run on a schedule whether or not anyone is watching, and the reverse is possible too. In my experience, councils have reviewed mastering reports that consolidated throughput, mastered records and other information about the records processed through Profisee. By those definitions, such reports measure flow; the question a council is asking is about adoption. This article is about telling them apart.
What “native” covers
The word needs fixing first, because the answer depends on it. By native I mean out of the box, with nothing configured beyond filling in the fields on a form that already exists. Profisee’s per-task Target Duration, Maximum Duration and digest notifications meet that bar, and I have said so before:
Yes, those would be 'native,' since all you're doing is filling in a pre-existing form field.
Profisee’s help pages describe the same settings. A contribution or approval task carries a target duration, the time within which it is expected to be completed; a maximum duration that expires the task automatically; a delivery preference for assignment and reminder notifications; and a reminder that fires at a percentage of the target [3]. Profisee’s page on configuring contribution and approval tasks describes the same target and maximum durations and a digest that sends notifications at a regular interval [4]. A workflow itself can also carry a target duration [5].
Notice what that list is: settings. They tell Profisee how long a task should take and what to do when it takes longer. They do not tell a council how many tasks met the target last month, or whether that number is rising. That is a different thing, a report, and Profisee’s pages that I read describe the settings and not the report. So a statement like “task duration is native” is true of the setting and false of the measurement, and the argument below depends on holding the two apart. I do not think my earlier answers conflict with this one. The settings are native; counting what they leave behind is the work.
Signal one: stewards opening the tool
I have one rule about this signal, and it is the one I would keep if I could keep only one:
The only thing that will guarantee stewards open the tool is making it an essential part of their daily activities. Transition their performance and reporting metrics and tie them to tool usage, and adoption spikes.
What can you read out of the box? As far as I can tell from Profisee’s documentation and announcements, not a steward-usage report. Profisee’s 2025 R3 announcement says user activity can be audited in the web portal [6], without saying which screen it means, and Profisee’s help describes Audit as a history, for one record at a time, of what was changed, when and by whom [14]. That is a trail you read record by record, not a count of who is doing the governing, and the 2026 R3 homepage metrics, covered below, describe the data and not the people [1]. What I did, in most of the implementations I have done, was the following:
Most Profisee implementations I have done have focused on pulling those metrics out and putting them on PowerBI, Tableau or other reporting system dashboards and that’s how Data Governance Monitoring and Adoption has been tracked.
The first sentence of that paragraph of my answer, quoted in the next section, classifies three of the four signals the question named. For now the point is narrower: who opens the tool is a number you pull out, not a number you are handed.
It is also the thinnest definition of use there is. Information-systems research has been arguing about what “system usage” even means for a long time. Burton-Jones and Straub proposed that usage has a structure of user, system and task, and argued that the choice of usage measure matters to what a study can conclude [7]. In their terms a login count is a lean measure: it records that use happened and says nothing about the task, which is the part a council cares about. DeLone and McLean’s updated success model, as Urbach and colleagues summarise it, keeps use, paired with intention to use, as one of six dimensions, beside information quality, system quality, service quality, user satisfaction and net benefits [8]. My reading is that a council which looks at logins alone is looking at one dimension of six in a well-known model of information-system success.
There is a second problem, and it comes from my own rule. If a steward’s performance metrics are tied to using the tool, use spikes, which is why I say it. But Strathern’s statement of Goodhart’s law is a warning about a number someone is judged on: “When a measure becomes a target, it ceases to be a good measure” [9]. Once logins are a target, a high count is what you would expect to see whether or not anyone is governing anything. I do not read that as a contradiction in the rule; the rule is how you get stewards into the tool. I read it as a reason to treat the login count as a floor, never as a score. If nobody opens the tool, nothing is being governed. If everybody does, you have learned very little.
Signal two: tasks closed inside the target
The settings are native, as above. The measurement is not, and this is where my answer for the second and third signals comes from:
All of the elements you’ve identified—tool opening/usage, task duration tracking, task queue duration—are secondary metrics that need to be pulled from the internal ‘reporting’ tables within Profisee.
That is the first sentence of the second paragraph of my answer, and it is the sentence I would put on the wall. Tool use, task duration and queue age are all secondary: derived from what the platform records, not displayed by it. I name no table here and did not name one when I was asked, so I will not invent one for you. What I will say is what the pull looks like in outline: read the task records, compare each completion time with its target, and put the result where the council already looks, which in my work has been Power BI, Tableau or whatever reporting system the organisation uses.
Profisee does give you one thing close to the measurement: an expiry is a recorded outcome. In the 2026 R3 designer a task that reaches its maximum duration without completion ends in an Expired outcome [3], and a connection is the path a workflow takes from one activity’s outcome to the next activity [5]. That is an alarm on a single task. Profisee also lists the open tasks and their status in its Workflow Administration screen, where an administrator can force an open task to complete or expire, for testing or troubleshooting [15]. Neither is a trend or a rate, and a council needs the rate.
How does this signal mislead? Mostly through the target, which is a number somebody chose. Closing 95 per cent of tasks inside a generous target is easy, and a council that reads it as service has been told something about the generosity of the target. I have not seen that happen in a way I can describe, so I mark this as my reading and not as experience. The accountability design that makes this signal worth having, who a task goes to, what happens on expiry, who is told, is the subject of The Queue Nobody Worked, and I will not repeat it.
Signal three: the age of the queue
Same source, same status: built from the same records, outside Profisee, and covered by the same quotation above. The open-task list in Workflow Administration [15] shows what is waiting; the pages I read say nothing about how long each item has waited. What changes is how to read it. I have said that the age of the oldest item in a steward backlog is an item-level measure and not a system-level one: a record that has been wrong in its source for years, in a platform that cannot exclude it, tells you the record is stuck, not that the programme is. I made that point in the week-10 piece on scoring, Mirror Finish, and it applies here without change.
So the age of the oldest task is a statement about a task. The age distribution across the whole queue, how many are young, how many old, whether the old ones are the same ones month after month, is a statement about the programme. The first is easy to put on a dashboard and the second is more work, which is the reason the first tends to be the one on the dashboard. That last clause is my reading.
Signal four: the 2026 R3 homepage metrics
This is the only one of the four that Profisee gives you without building anything, and Profisee presents it as day-to-day metrics for data stewards [1], and it is why my answer said what it said. First, a statement of what I am working from. I am implementing 2026 R3 at a client now, and I will write up that experience in later articles, once there is something to report. What I have today is pre-release testing, Profisee’s own demonstrations and Profisee’s public material. So what follows rests on that basis, and it is not a record of running the feature for a council.
Profisee’s release notes describe an analytics strip on the homepage that shows five key performance indicators, summarising the “daily health and scale” of the environment: Total Records, Data Quality Score, Active Data Quality Issues, Golden Records and Total Entities. Each one can be opened to see the changes behind it over a period, and seeing any of it requires a new Analytics Viewer role [1]. Profisee’s own announcement describes the same area as charts for stewards and administrators, showing an overall data health score, active data quality issues and a breakdown of match status, so that teams no longer need to build and maintain separate reports just to see where things stand [2]. The two descriptions differ in detail, and when I was asked which metrics I meant, I confirmed that they were the five in the release notes. Two things follow from the notes themselves.
The first is that the feature is native in my sense and is not automatic. It exists out of the box and somebody still has to grant the role, unless the viewer is a Super Administrator [13]. The second is more important: every one of the five is a measure of the data and its scale. None is about a steward, a task or a queue. That is why I called the feature significantly beneficial and still put it fourth in a list about adoption. It answers a council’s question about whether the data is healthy. It answers the question about whether the programme is adopted only indirectly, and an indirect answer can be wrong in both directions: the count of active issues falls when stewards work, and also when someone changes the rules.
That brings up the Data Quality Score, which Profisee does document [13]. It is a figure from 0 to 100: the share of records with no open data quality issue, taken only across entities that have at least one data quality rule configured. An entity with no rules adds nothing to the records evaluated or to the records that passed, unless a setting in the analytics service is changed from its default, which leaves such entities out. The score is weighted by each included entity’s record count [13]. Read by the formula as documented, the score is a statement about the rules that exist. A programme that writes rules for a few entities and leaves the rest unruled can show a high score, and putting rules on a large new entity can move the score, up or down, without a single steward doing anything differently. As I described in Who Holds the Switch, a Profisee rule flags the records that fail it, so the score can only be as informative as the rule set behind it. A council that trusts the score should ask which entities are in it and who wrote the rules before it asks whether the number is going up.
Profisee also documents how fresh the strip is. The figures come from a daily snapshot, not a live query: the job runs once a day, by default at 09:00 UTC, a day on which the analytics service is down from start to finish is skipped and not backfilled (a shorter outage still runs that day), and the trend arrows compare the latest value with one from about a week earlier, as Profisee describes them, appearing only once enough history exists [13]. The strip is visible to holders of the Analytics Viewer role and to Super Administrators [13]. For a council, the practical reading is that these are daily figures about the data with a trend of about a week: a missing arrow means there is not yet enough history, and a flat arrow means only that the figure has not changed against that earlier value.
I have also said what I expect these metrics to become. It is an expectation, not an observation:
Previously, Councils generally reviewed mastering reports that consolidated throughput, mastered records and other information that were generated off of the records processed through and within Profisee, but the reports themselves were almost always generated in other systems—PowerBI, Tableau, etc. With the advent of the new homepage metrics, I would expect to see that report become a central health report for the Profisee system that would be broadly distributed—including to the Council.
About the feature as a first release, these were my words:
There are the obvious limitations--of which Profisee is well aware--and opportunities for expansion, but this is an initial release of a new feature. Therefore such limitations and shortcomings are to be expected and I anticipate they will be addressed over time.
That is my expectation, not a commitment I am reporting from Profisee. I have not yet run the feature for a council; when I have, I will say which limits mattered.
The metric that would mislead
I was asked which of the four would mislead a council that trusted it. My answer did not choose one of the four. It named a fifth.
The biggest ‘misleading’ metrics are those related to throughput because throughput does not indicate quality.
That is consistent with what I have said before about the numbers that lie: the count of mastered records, throughput, time to master, and every other measure of how much data is moving and how fast. In that earlier answer, the reason I gave was that those figures are prone to over- and under-matching by the governance group to game the numbers, and the week-10 piece Mirror Finish has the argument. Throughput and mastered-record counts move when a team matches more or less aggressively, and when the match rules change. Neither says the data got better.
I should be fair to flow measures, because they are not useless. At one client we had automated reports, run each morning during ingestion, that flagged irregularities and anomalies, which let a monitoring team find and correct a systemic source error before users started their day. That was a flow report doing exactly the job it is good at. It is a measure of the pipe. It does not tell you whether anyone is governing what comes through it.
Why does throughput persist? Because it is the easiest to build. In my experience those are the figures clients approve: basic reporting on throughput, mastering lag and automated error reporting. My reading is that what gets measured tends to be what is simple to measure, and that it then becomes the target, which is exactly where Strathern’s warning bites [9]. A council that sees only flow will conclude, reasonably, that governance is a flow problem.
What I would build
If I were to build reporting that did a better job of tracking good governance, I would not start from the tool’s own counts at all.
If I were to put together operational tracking reports and data analytics that did a better job of tracking ‘Good Governance,’ I would tie them to Week over Week and Month over Month tracking of the downstream reporting values and have weekly surveys of users asking about their perspective on data quality the preceding week.
Two halves, then. The first is the downstream numbers: whatever the data is for, the reports and measures that consume it, tracked week over week and month over month. My reasoning is that if governance is working, those should stop surprising people. The second is a short weekly survey of the people who use the data, asking how they found its quality the week before. I have never been allowed to build it.
Sadly, I have yet to have a client approve that level of reporting because it’s significantly more complex to implement than basic reporting metrics around throughput, mastering lag and automated error reporting.
The survey half has support in the data-quality literature. Wang and Strong’s early work on data quality built its framework by asking data consumers what quality means to them, and argued that consumers hold a much broader view of quality than the accuracy-centred one that information-systems professionals tend to assume [10]. Lee and colleagues built a measurement method around a questionnaire and illustrated it through its application to five major organisations [11], and Pipino and colleagues set out how subjective assessments from the people who use data can be combined with objective measurements taken from the data itself [12]. So combining what users report with objective measures has a basis in the data-quality literature, though there the objective half is measured on the data itself, not on downstream reports. I have not claimed more than that. None of it shows that my particular design works, because I have never run it.
The case against it is worth stating plainly, because a council will hear it. A weekly survey costs the very people whose attention you are trying to keep. Changes in downstream reports can come from the business and not from governance, so attributing them is hard. The same respondents answering every week may drift. And it is considerably more work than a throughput chart, which is the objection behind the answer I have had so far. I cannot tell you which of the first three would bite, because I have not seen it run. I can tell you that the fourth is the one that has decided it for the clients I have asked.
A map, and a question for the council
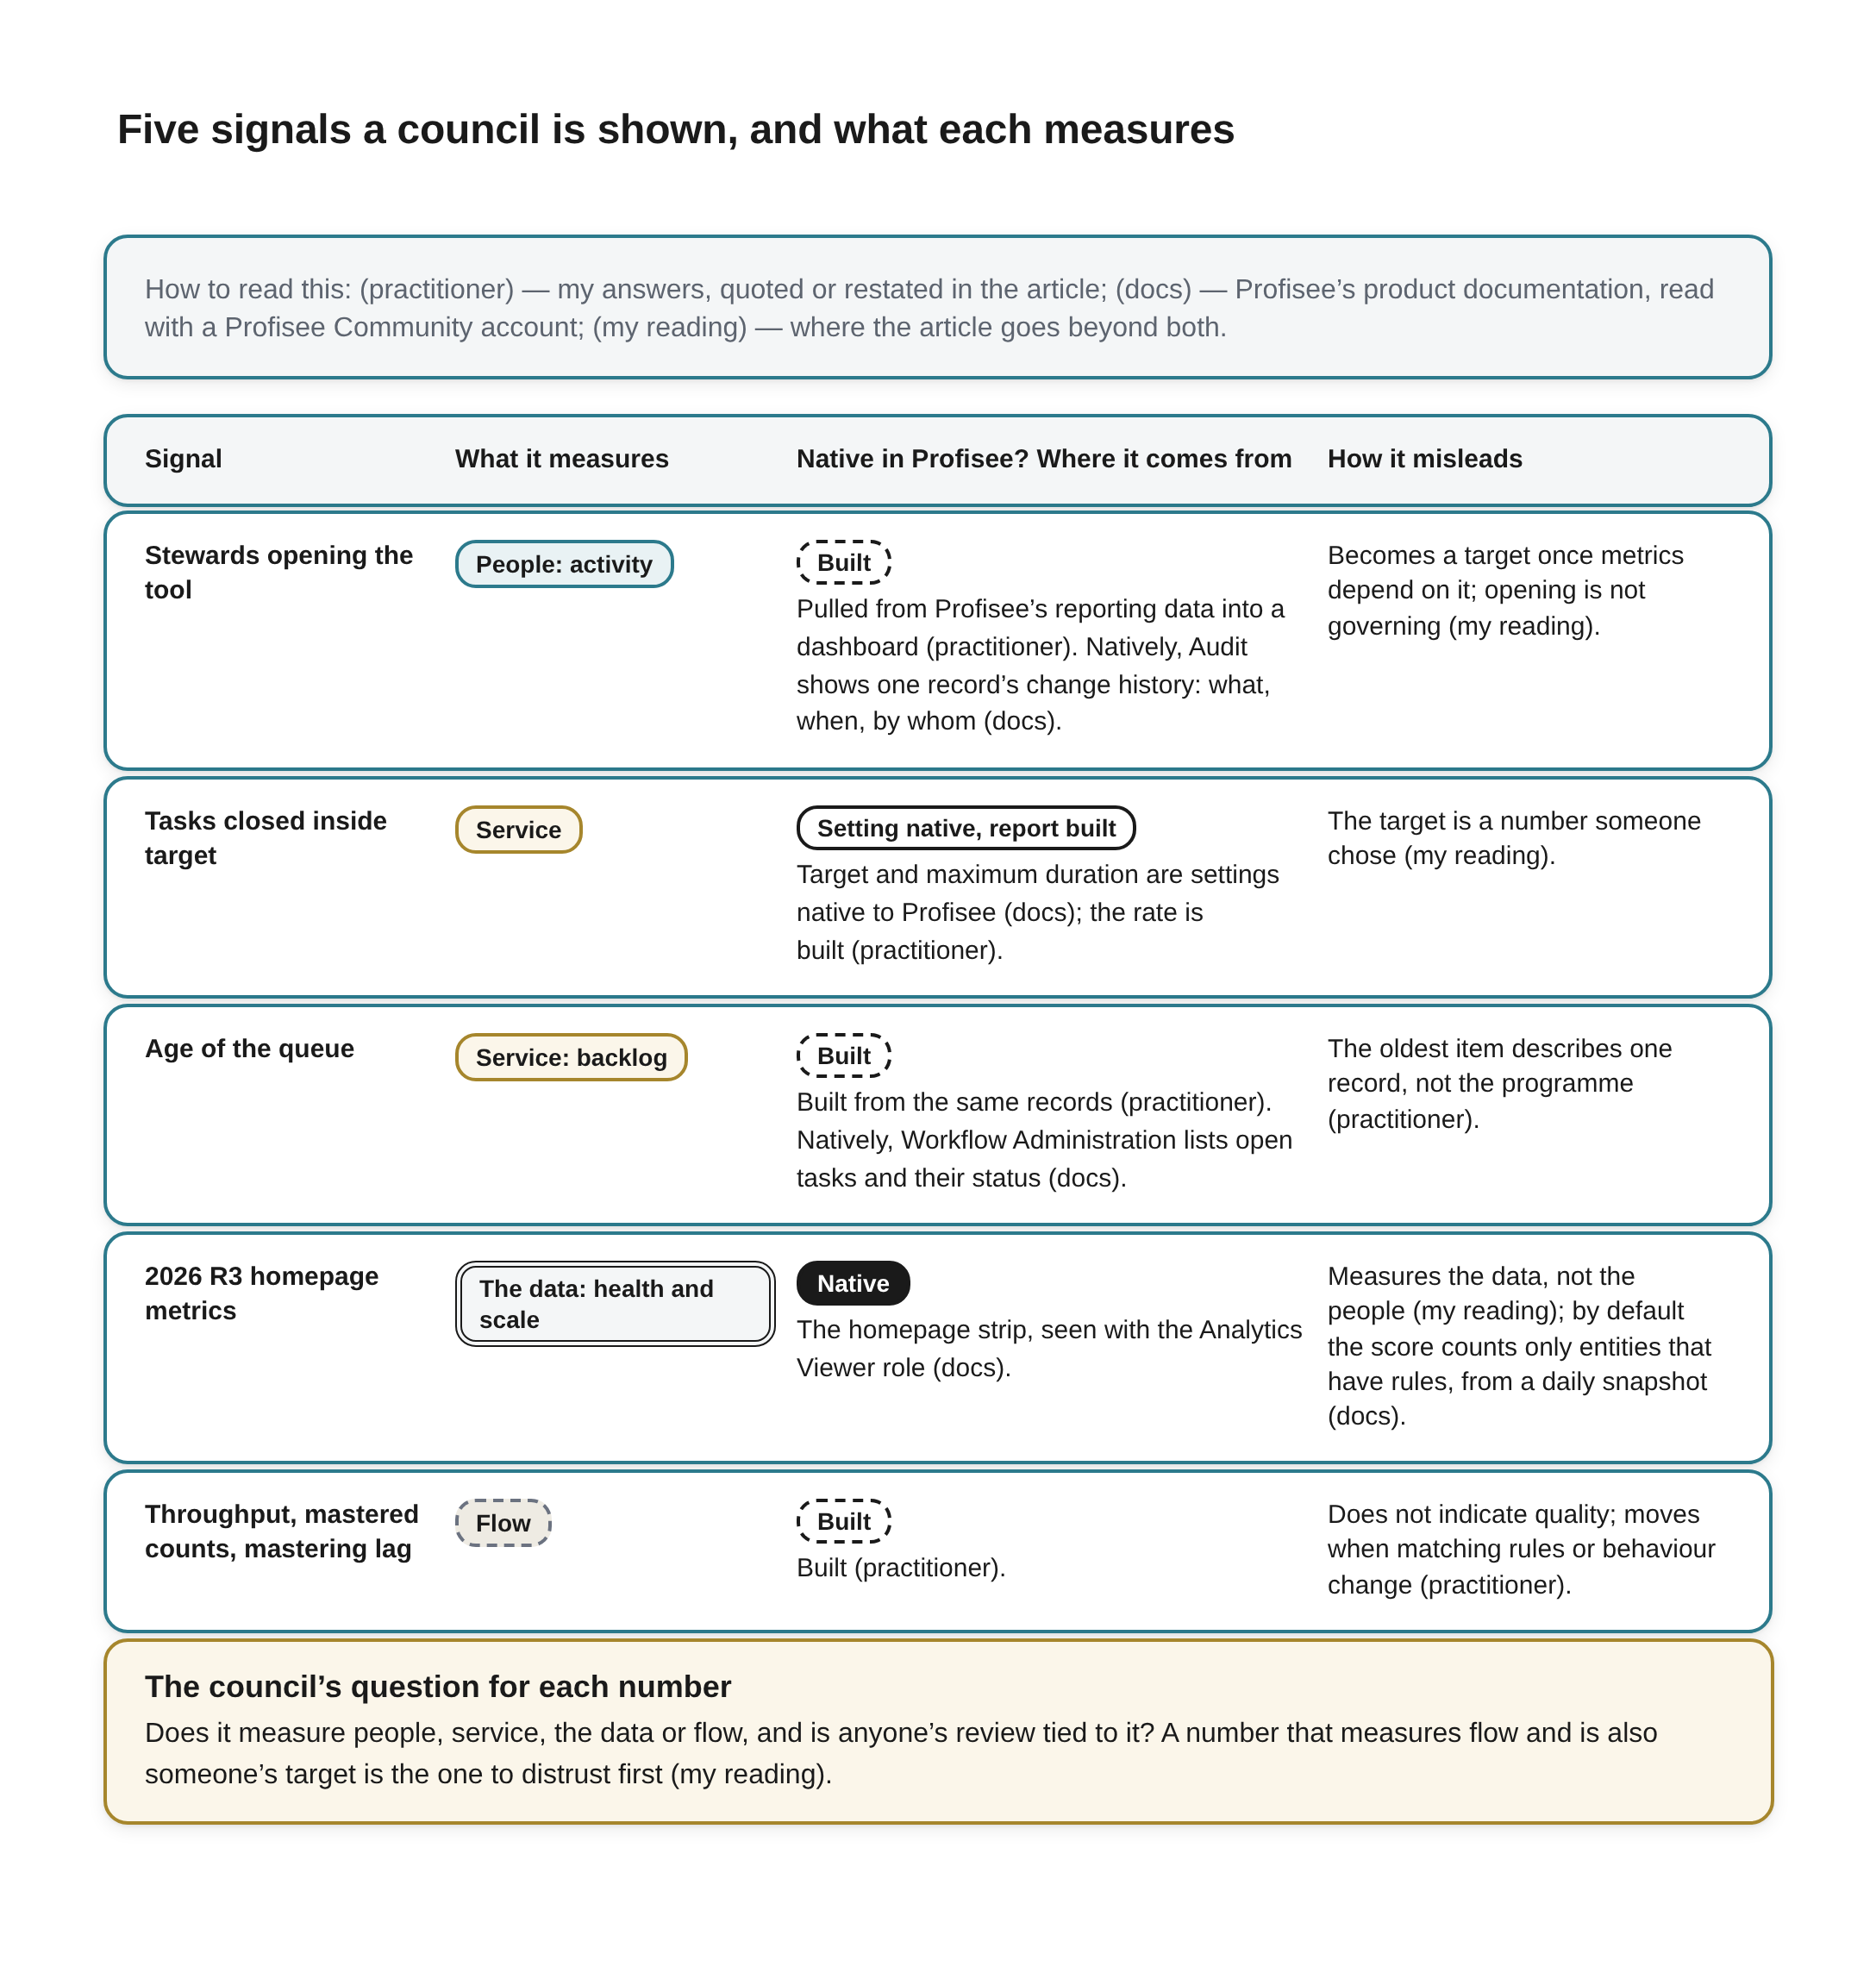
Five signals a council is shown, and what each measures Beneath the title a key reads: How to read this: (practitioner) — my answers, quoted or restated in the article; (docs) — Profisee’s product documentation, read with a Profisee Community account; (my reading) — where the article goes beyond both.
A table with four column headings: Signal, What it measures, Native in Profisee? Where it comes from and How it misleads. In the second column each signal has a chip naming which of four things it measures, each with its own outline: People (solid teal outline), Service (solid gold outline, used for two signals), The data (double outline) and Flow (dashed outline). In the third column a chip reads Native (filled), Setting native, report built (solid outline) or Built (dashed outline), above where the signal comes from.
- Stewards opening the tool. What it measures: People: activity. Native in Profisee? Built. Where it comes from: Pulled from Profisee’s reporting data into a dashboard (practitioner). Natively, Audit shows one record’s change history: what, when, by whom (docs). How it misleads: Becomes a target once metrics depend on it; opening is not governing (my reading).
- Tasks closed inside target. What it measures: Service. Native in Profisee? Setting native, report built. Where it comes from: Target and maximum duration are settings native to Profisee (docs); the rate is built (practitioner). How it misleads: The target is a number someone chose (my reading).
- Age of the queue. What it measures: Service: backlog. Native in Profisee? Built. Where it comes from: Built from the same records (practitioner). Natively, Workflow Administration lists open tasks and their status (docs). How it misleads: The oldest item describes one record, not the programme (practitioner).
- 2026 R3 homepage metrics. What it measures: The data: health and scale. Native in Profisee? Native. Where it comes from: The homepage strip, seen with the Analytics Viewer role (docs). How it misleads: Measures the data, not the people (my reading); by default the score counts only entities that have rules, from a daily snapshot (docs).
- Throughput, mastered counts, mastering lag. What it measures: Flow. Native in Profisee? Built. Where it comes from: Built (practitioner). How it misleads: Does not indicate quality; moves when matching rules or behaviour change (practitioner).
A full-width box outlined in amber, headed The council’s question for each number: Does it measure people, service, the data or flow, and is anyone’s review tied to it? A number that measures flow and is also someone’s target is the one to distrust first (my reading).
Read down the figure’s column on whether Profisee supplies each one and the pattern is plain. Profisee gives you the dials for the evidence, and since 2026 R3 a native view of the data’s health. It gives you views of single records and of the open-task list, not a measure of whether people are doing the governing. That measure has almost always been built outside it, in the tools a council already trusts, and for that purpose, as I said in my answer, the operational reporting and the performance numbers have long lived in ticketing and tracking systems such as ServiceNow.
The question I would put to a council is a short one. For each number on your governance dashboard, ask whether it measures people, service, the data or flow, and then ask whether anyone’s review is tied to it. A number that measures flow and is also someone’s target is the one to distrust first.
References
[1] Profisee, “New Features and Enhancements for 2026 R3,” Profisee Release Notes, support.profisee.com. Login required; Homepage Metrics section read 2026-10-18 and again 2026-11-15, signed in with a Profisee Community account. Vendor documentation (the vendor we partner with). https://support.profisee.com/wikis/release_notes/New_Features_and_Enhancements_for_2026-R3
[2] Eric Melcher, “Profisee 2026 R3: Smarter. More Connected. Built on Trust.,” Profisee blog (12 October 2026). Read in full 2026-10-18. Vendor source (the vendor we partner with). https://profisee.com/blog/profisee-2026-r3-smarter-more-connected-built-on-trust/
[3] Profisee, “Collaboration Activities,” Profisee Platform Help (2026 R3 designer), support.profisee.com. Login required; read 2026-10-18 and again 2026-11-15 with a Profisee Community account. Vendor documentation (the vendor we partner with). https://support.profisee.com/wikis/profiseeplatform/collaboration_activities
[4] Profisee, “Configuring Contribution and Approval Tasks,” Profisee Platform Help, support.profisee.com. Login required; read 2026-10-18 and again 2026-11-15 with a Profisee Community account. Vendor documentation (the vendor we partner with). https://support.profisee.com/wikis/profiseeplatform/configuring_contribution_and_approval_tasks
[5] Profisee, “Designing Custom Workflows in Profisee,” Profisee Platform Help (2026 R3), support.profisee.com. Login required; Workflow Properties read 2026-10-18 and again 2026-11-15 with a Profisee Community account. Vendor documentation (the vendor we partner with). https://support.profisee.com/wikis/profiseeplatform/designing_custom_workflows_in_profisee
[6] Profisee, “Profisee 2025 R3: AI-Powered MDM with Full Web Control and Native Fabric Integration,” Profisee blog. The web-portal passage read, and the page title checked, 2026-11-15. Vendor source (the vendor we partner with). https://profisee.com/blog/profisee-announces-new-release-2025-r3/
[7] Andrew Burton-Jones and Detmar W. Straub Jr., “Reconceptualizing System Usage: An Approach and Empirical Test,” Information Systems Research 17(3), 228-246 (2006). Full text read 2026-11-15 for the passages cited. Cited for what the paper reports; not assessed. https://doi.org/10.1287/isre.1060.0096
[8] William H. DeLone and Ephraim R. McLean, “The DeLone and McLean Model of Information Systems Success: A Ten-Year Update,” Journal of Management Information Systems 19(4), 9-30 (2003). Abstract read 2026-11-15; full text paywalled and not read; the six dimensions are as summarised by Urbach, Smolnik and Riempp (AMCIS 2008). Cited for what the paper reports; not assessed. https://jmis-web.org/articles/271
[9] Marilyn Strathern, “‘Improving ratings’: audit in the British University system,” European Review 5(3), 305-321 (1997). Full text read 2026-11-15 in a copy of the published article; the quotation is on p. 308. Cited for what the paper says; not assessed. https://www.cambridge.org/core/journals/european-review/article/improving-ratings-audit-in-the-british-university-system/FC2EE640C0C44E3DB87C29FB666E9AAB
[10] Richard Y. Wang and Diane M. Strong, “Beyond Accuracy: What Data Quality Means to Data Consumers,” Journal of Management Information Systems 12(4), 5-33 (1996). Full text read 2026-11-15 in the copy on MIT’s TDQM site. Cited for what the paper reports; not assessed. https://web.mit.edu/tdqm/www/tdqmpub/beyondaccuracy_files/beyondaccuracy.html
[11] Yang W. Lee, Diane M. Strong, Beverly K. Kahn and Richard Y. Wang, “AIMQ: a methodology for information quality assessment,” Information & Management 40(2), 133-146 (2002). Abstract read 2026-11-15; full text paywalled and not read. Cited for what the paper reports; not assessed. https://doi.org/10.1016/S0378-7206(02)00043-5
[12] Leo L. Pipino, Yang W. Lee and Richard Y. Wang, “Data Quality Assessment,” Communications of the ACM 45(4), 211-218 (2002). Full text read 2026-11-15 for the passages cited. Cited for what the paper reports; not assessed. https://doi.org/10.1145/505248.506010
[13] Profisee, “Homepage Analytics,” Profisee Platform Help (2026 R3), support.profisee.com. Login required; read in full 2026-11-15 with a Profisee Community account. Vendor documentation (the vendor we partner with). https://support.profisee.com/wikis/profiseeplatform/homepage_analytics
[14] Profisee, “Audit Overview,” Profisee Platform Help (2026 R3), support.profisee.com. Login required; read in full 2026-11-15 with a Profisee Community account. Vendor documentation (the vendor we partner with). https://support.profisee.com/wikis/profiseeplatform/audit_overview
[15] Profisee, “Viewing and Managing Task Activity,” Profisee Platform Help (2026 R3), support.profisee.com. Login required; read 2026-11-15 with a Profisee Community account. Vendor documentation (the vendor we partner with). https://support.profisee.com/wikis/profiseeplatform/viewing_and_managing_task_activity