Mirror Finish
Weaving Intelligence (House AI Style), with Jeff Shabel’s Experiential Commentary
I have stood up every part of the traditional governance package at one time or another, and that includes the maturity score: the assessment that places a programme on a ladder of five levels and tells the steering committee which rung it is standing on (Keep the Policy, Keep the Score, Move the Council). I have also called maturity models, along with councils and stewardship models and the rest, correct and oversold. They are right about what good looks like, and they are sold as if knowing it were the same as doing it, to organisations that will give the whole effort the same lip service they give mandatory training (Rules of Decreasing Strictness). So the question put to me for this piece was a fair one. If a maturity level is not how I know a governance programme is working, what is? Which two or three numbers would I look at after the first year, and after the third? And which of them lies most easily?
The last question was the one that mattered, and I answered it first, with a whole class of numbers rather than one:
The lies are simple: number of ‘mastered’ records, throughput, time to master and all the various metrics surrounding how fast and how much data is running through the system. Those are the statistics that will lie to you because they’re prone to over and under matching by the Data Governance group to ‘game’ the numbers.
That answer names the numbers a master data platform counts for you without being asked, and it says something less comfortable about who distorts them. The people best placed to make a governance programme look healthy are the programme's own governance group, and the lever they hold is the one that produces the headline count. The rest of this piece is about why that is, what I would score instead, where my own preferred measures can lie as well, and what a maturity level is still good for once you stop asking it to do their job.
Why the volume numbers lie
Start with the count of mastered records, because it looks the most like an outcome. A master data hub takes records about the same real thing from several sources, decides which of them describe the same customer or product or supplier, and keeps one golden record for each. The figure that gets reported is the mastered count: how many of the source records have been matched into a golden record. Its mirror is the unmastered count, the records the matcher has joined to no other. (Those are the terms as I use them here; many programmes report the same thing as a match rate.) Any report can produce either at the end of every run. It looks like a measure of the data. It is largely a measure of a setting.
Deciding that two records describe the same customer is a judgement made under uncertainty, and the theory of it was formalised in 1969, when Ivan Fellegi and Alan Sunter set it out [1]. Any matching process can make two kinds of mistake. It can link two records that belong to different people, or it can leave apart two records that belong to the same person. Fellegi and Sunter showed that a matcher chooses its thresholds by deciding how many of each error it will tolerate [1]; move the threshold one way and you get fewer missed matches and more false merges, move it the other way and you get the reverse. In the software that does this today, the mechanism is literal. Splink, the open-source matching library built by the UK Ministry of Justice, treats every pair whose score is "at or above this threshold" as matched and then groups matched pairs into clusters, one cluster for each entity it believes it has found [2]. Change the threshold and you change which pairs are joined, and with them how many clusters come out. Olivier Binette and Rebecca Steorts, surveying the whole field in 2022, add two warnings: the error rates a Fellegi-Sunter matcher is designed for "are not attained in practice," and "extreme care should be taken regarding sensitivity of tuning parameters" [3]. Nothing about the data has to change for the count to change. The count moves when the threshold moves, and the threshold is set by whoever owns the match rules.
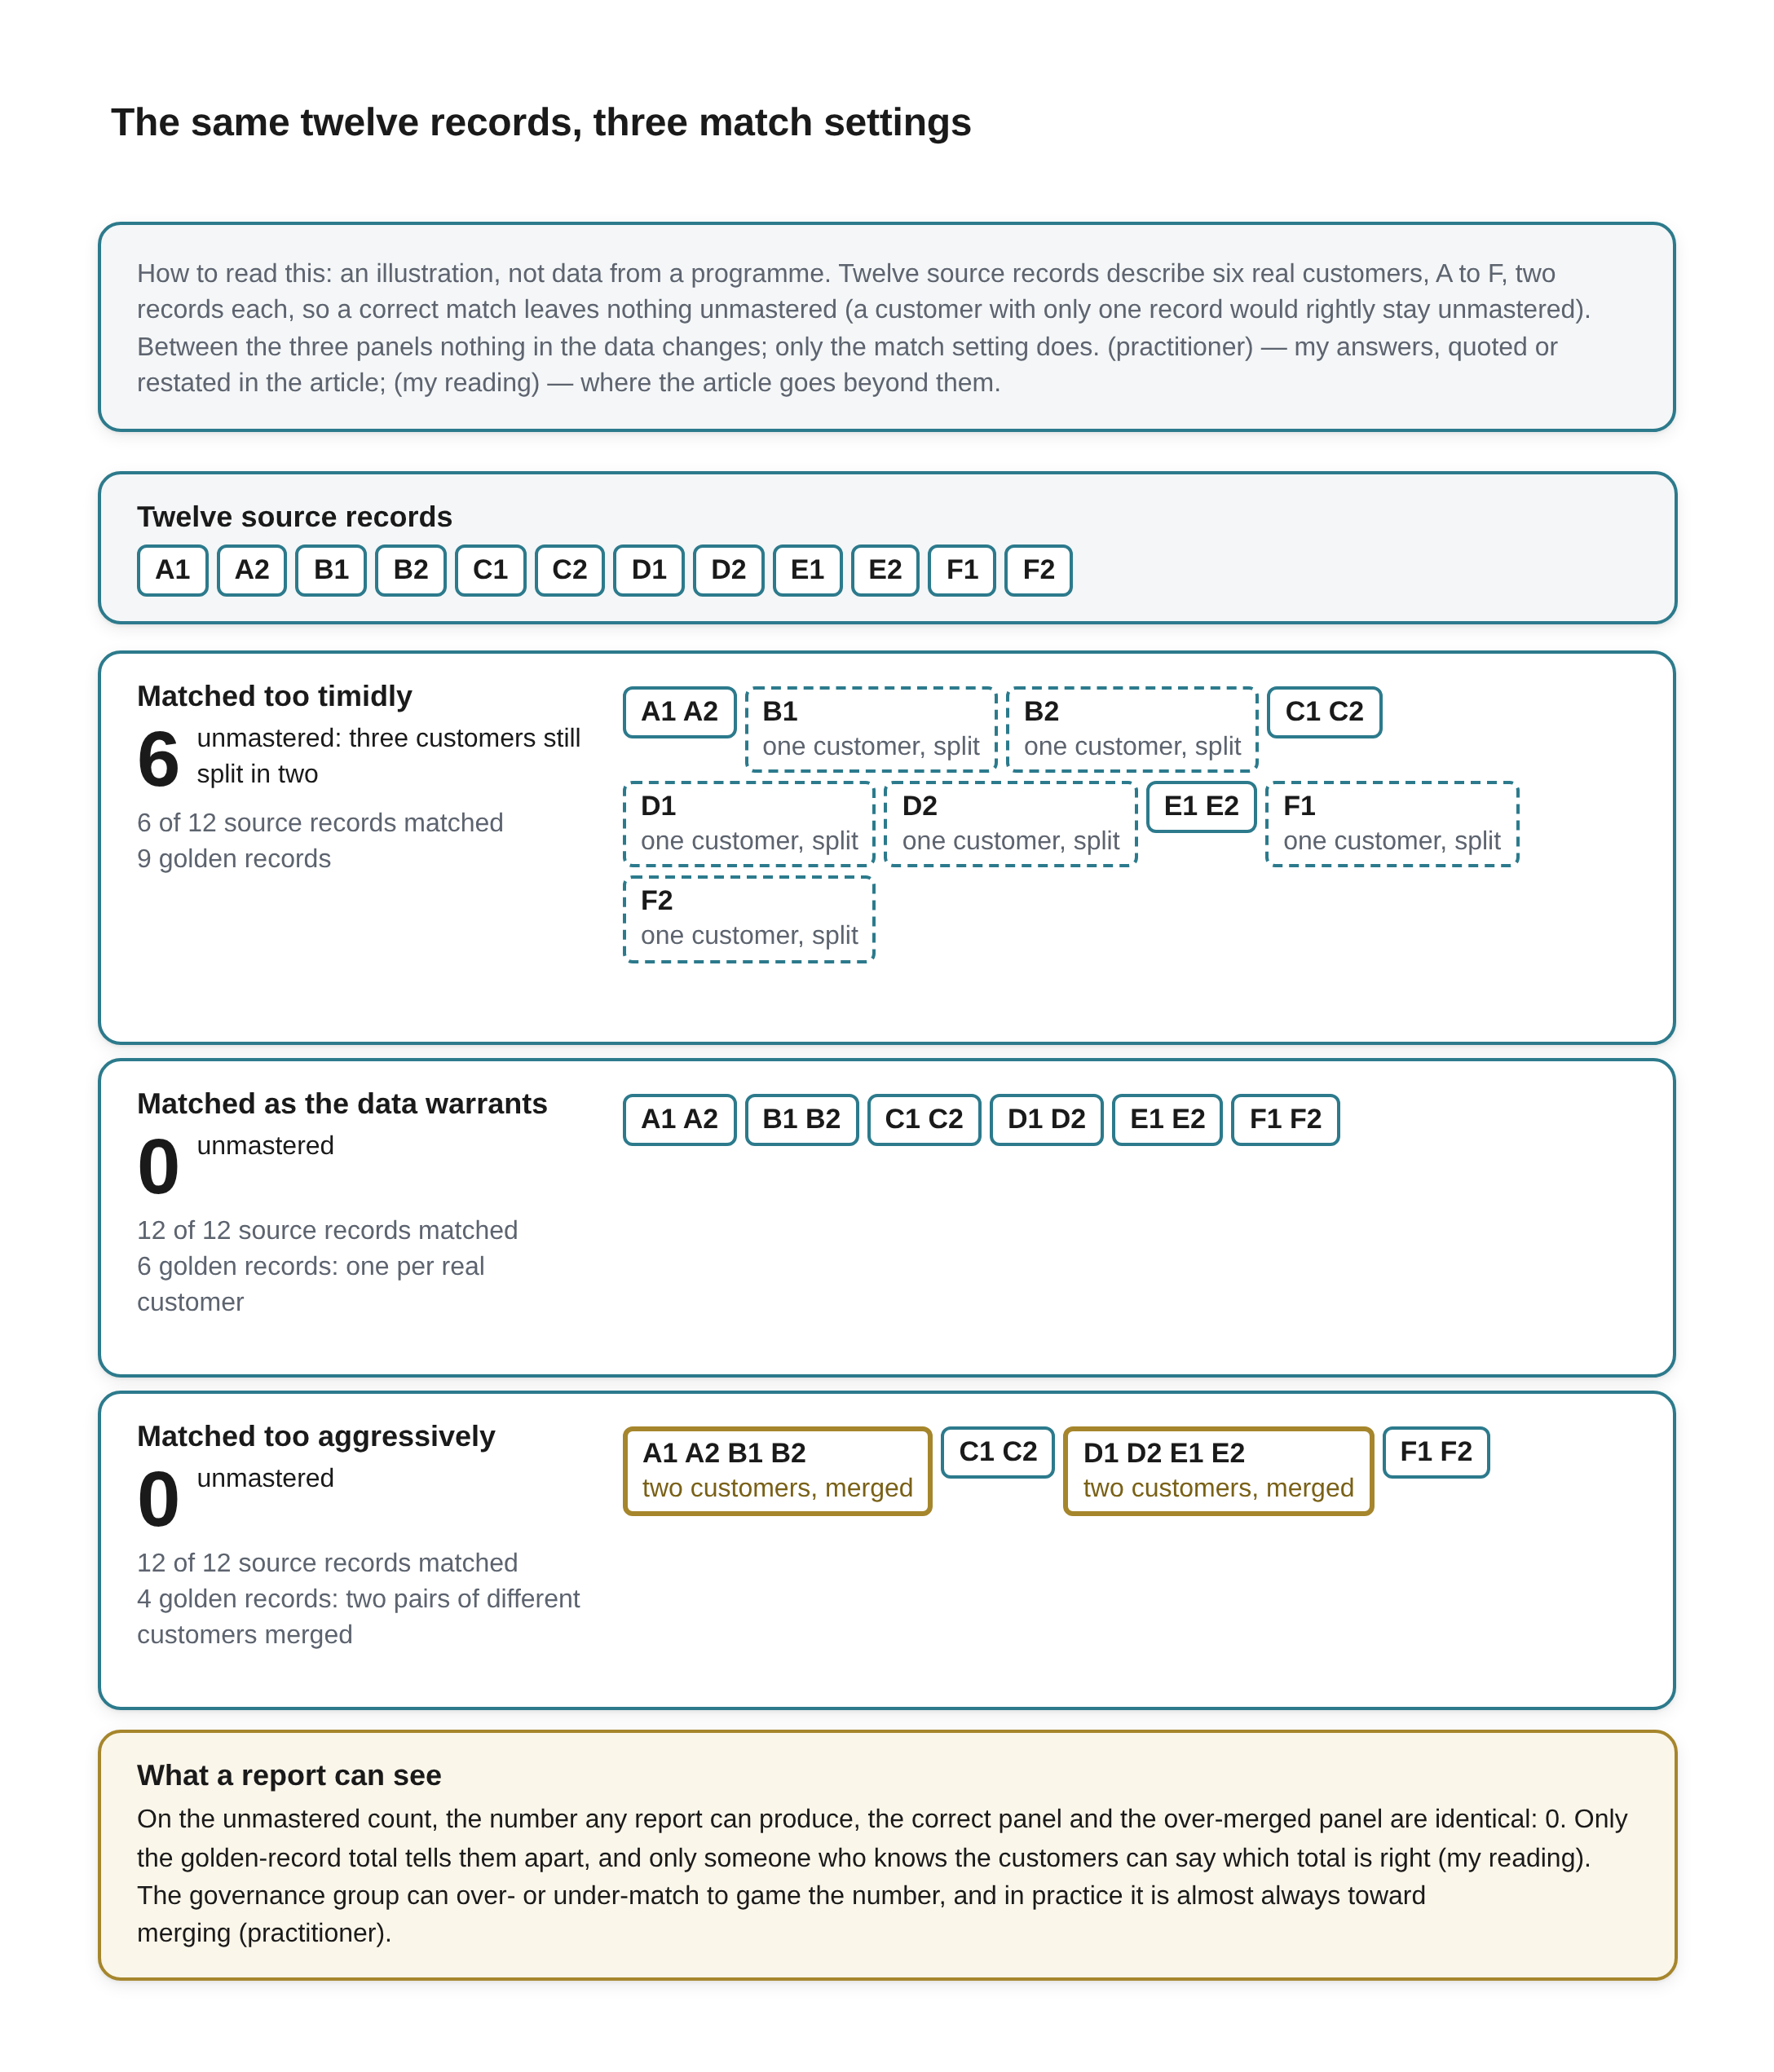
The same twelve records, three match settings Beneath the title a key reads: How to read this: an illustration, not data from a programme. Twelve source records describe six real customers, A to F, two records each, so a correct match leaves nothing unmastered (a customer with only one record would rightly stay unmastered). Between the three panels nothing in the data changes; only the match setting does. (practitioner) — my answers, quoted or restated in the article; (my reading) — where the article goes beyond them.
A strip headed Twelve source records shows twelve small boxes: A1, A2, B1, B2, C1, C2, D1, D2, E1, E2, F1, F2. Below it are three panels, each with a large unmastered count beside a line of explanation, two smaller lines giving the share of source records matched and the golden-record total, and the golden records drawn as boxes holding the source records grouped into them. A box with a dashed outline is marked “one customer, split”; a box with a thick amber outline is marked “two customers, merged”.
- Matched too timidly: 6 unmastered: three customers still split in two; 6 of 12 source records matched; 9 golden records. The boxes: A1 A2; B1 (marked “one customer, split”); B2 (marked “one customer, split”); C1 C2; D1 (marked “one customer, split”); D2 (marked “one customer, split”); E1 E2; F1 (marked “one customer, split”); F2 (marked “one customer, split”).
- Matched as the data warrants: 0 unmastered; 12 of 12 source records matched; 6 golden records: one per real customer. The boxes: A1 A2; B1 B2; C1 C2; D1 D2; E1 E2; F1 F2.
- Matched too aggressively: 0 unmastered; 12 of 12 source records matched; 4 golden records: two pairs of different customers merged. The boxes: A1 A2 B1 B2 (marked “two customers, merged”); C1 C2; D1 D2 E1 E2 (marked “two customers, merged”); F1 F2.
A full-width box outlined in amber, headed What a report can see: On the unmastered count, the number any report can produce, the correct panel and the over-merged panel are identical: 0. Only the golden-record total tells them apart, and only someone who knows the customers can say which total is right (my reading). The governance group can over- or under-match to game the number, and in practice it is almost always toward merging (practitioner).
My answer put that dial in the governance group's hands, and that is where it sits wherever the group writes and tunes the match rules and decides when a borderline pair is close enough. The group being judged by the mastered count is then the group that sets the setting that produces it. Asked whether the gaming usually runs one way, toward a better-looking mastered count or match rate (call that A), or either way, depending on which number the group is judged on (B), I did not hedge:
Oh, A, almost 100% of the time. It's rare for a 'Master Data Report' to be able to identify incorrectly Mastered records, but any report can tell Mastered from Unmastered and the Unmastered number gets looked at while the 'Incorrectly Mastered' number only gets noticed if reports are off--and then it's highlighted to be fixed ASAP by other groups than Data Governance, so it jumps up the priority list. It's also an efficient way of identifying who's looking at the reports, who isn't and, more importantly, who knows what the reports should say.
The reason is an asymmetry in what can be seen. An unmastered record is visible to anyone with a report: it is the row that has not been matched to anything, and counting those is the easiest query there is. A wrongly mastered record, two customers folded into one, looks exactly like a correct one until something downstream comes out wrong, unless someone is counting the merges that later have to be undone. So the pressure all runs one way. Merging more eagerly makes the unmastered number fall and the mastered count rise, and the cost of a bad merge is deferred until a report breaks, when it lands on whichever team owns that report and becomes their emergency. Matching too timidly can game a number too, and my first answer allowed for both, but in the programmes that answer describes it is the rare direction. A reasonable objection is that careful teams set their matchers conservatively, because a false merge is harder to undo than a missed one. My reading is that both are true: the caution holds where someone has already been burned by a bad merge, and the pressure I described holds wherever the unmastered number is what gets judged. The figure on the slide improves, and the data underneath it gets worse in a way the slide cannot show. That is the mirror finish of the title: a polish so good you can see your face in it, laid over records that are wrong.
The last sentence of that answer is the one I would underline for anyone designing a scorecard. When a bad merge does surface, the way it surfaces tells you who is actually reading the reports, who is not, and who knows what the numbers ought to say. That is information about the organisation that no mastered count will ever give you.
The other numbers in the class fail the same way, by a shorter road. Throughput, the number of records the platform processed in a period, measures the pipe and is indifferent to what flows through it; a feed of bad records counts exactly as a feed of good ones, and a reprocessing run inflates it without improving anything. Time to master, how long a record takes to go from arrival to golden, can be cut by the governance group too, by auto-approving the pairs that used to wait for a steward or by widening what the matcher is allowed to decide alone. Each of those changes makes the programme look faster. None of them tells you whether the records it produces faster are right. Read beside error recurrence, though, a faster time to master that sends more errors back shows itself for what it is.
The platforms make these numbers easy to collect, which is part of their appeal. Informatica's cloud master data service, for one, reports, for its jobs that load records, "The total number of records that were processed." and, for its match jobs, "The number of records that were successfully matched." [4]. Published lists of master data KPIs recommend reducing the cycle time for setting up a new account and increasing "the number of new accounts setup per FTE" [5]. To be fair to the vendors, the vendor guidance on proving master data's value read for this piece mostly talks about business outcomes rather than a raw golden-record count. Even the metrics meant to check a matcher can flatter it: Matt Barnes, writing a practitioner's guide to evaluating matching results, warns that pairwise match metrics "may convey overly optimistic results", depending on the use case, and recommends checking a matcher with a cluster-level measure as well as the pairwise ones [6]. A count is not worthless in itself, though. My reading is that a mastered count reported together with the threshold that produced it and an audited sample of its errors is a different and much more honest number. It is rarely reported that way, and that too is my reading: Informatica's job metrics, the one platform's metrics cited here, list the matched count with no threshold beside it [4], and a bare count on a slide is the version that gets read.
None of this is a new observation about measurement in general. The anthropologist Marilyn Strathern, writing about audit in British universities, gave the idea its best-known form: "When a measure becomes a target, it ceases to be a good measure" [7]. She took the idea from the educationalist Keith Hoskin, then in a post in management accounting, who had called it Goodhart's law after the economist Charles Goodhart's observation about instruments of monetary control [7]. I have already argued, in the piece on the traditional governance package, that a governance score is exactly the kind of number that law describes, and that writing the policy first is what makes a dishonest score detectable (Keep the Policy, Keep the Score, Move the Council). What the answer above adds is the specific mechanism for master data. The mastered count is not merely a number people can be tempted to improve. It is a number one group can improve without touching a single record, simply by changing how strictly it matches.
The count I still use
Here I owe the reader a reconciliation, because last month I gave a different-sounding answer. When a client asks me to prove that a master data platform is delivering, I count the source records coming in from each source, count the mastered records, and score the mastered records on how complete they are, read for each entity, for the system as a whole and for the few entities the business cares most about (Proving the Platform Is Delivering). A count of mastered records is in that list, and it is first among the liars in the answer above. Whichever way it is counted, as golden records or as source records matched into them, it is the output of a match setting.
Asked whether that meant the count is an honest measure of the flow through the platform and a dishonest one of governance, I agreed, and put the two in order:
Yes. You have to have consistent Flow before you can say you're applying Governance, so Flow numbers changing dramatically indicate something's wrong with the System, which is a predecessor for Governance.
So the two measures are stages, not rivals. Whether the platform is delivering is a question about flow: is data arriving from every source it should, is it being mastered at all, is the mastered output filling out or thinning. For that, the count is a fair instrument, and its value is in its change over time, read as far back as the history goes, never against a target of a hundred percent. Whether governance is working is a question about the decisions people made: did they match the right records, settle the right definitions, put the right controls on the right fields. For that, the same count is a liar, because it is the output of one of those very decisions. And the order matters. If the flow numbers are swinging, the platform has a problem, and any governance scorecard read on top of it is measuring noise. A sudden drop in mastered records belongs on the flow dashboard as a fault to investigate. On the governance scorecard, presented as progress, it is a claim nobody can check.
What I would score instead
The second half of my answer named the measures I trust:
The ones that won’t lie to you are the ones you’ve highlighted: share of CDEs under policy, share of data that’s been classified, time to settle contested definitions, error recurrence are all ‘good’ metrics that provide value because they measure the Quality of the Data Governance Approach rather than the throughput of the garbage through the system that results in a mirror finish shine on incorrect records.
So the list is the share of critical data elements under a policy, the share of the data that has been classified, the time it takes to settle a contested definition, and how often the same error comes back. One measure the question suggested is missing on purpose: the age of the steward backlog. Asked why, I said it measures something narrower than the programme:
It's really an indicator of the complexity of the problem with that specific piece of data. One record that's been wrong in the source for three years with an inability to correct in the source system and in an MDM system with the inability to exclude specific records doesn't tell you anything about the current state of the system, just that there's a record that's 'stuck'--in this case permanently.
Measured the usual way, by its oldest open item, a backlog's age is a property of its hardest item. One record that cannot be corrected where it was produced, in a hub that cannot set it aside, will hold the oldest-item figure hostage for as long as the programme runs, whatever else improves around it. A median age is less hostage to one item, but it still describes the items in the queue rather than the governance around them. That makes backlog age a good signal for escalation, item by item, and a poor number for the scorecard. The reason I gave for trusting the four is the important part: they score how good the governance is, not how much passes through. Each of them is a reading of a decision or a habit of the governance group, rather than of the volume the platform handles. Taken one at a time:
The share of critical data elements under a policy. A critical data element is a field that something important depends on. The European Central Bank's 2024 guide on risk data aggregation, written for the banks it supervises, puts the test plainly: the critical data elements underlying the key risk indicators "should also be explicitly identified" [8]. It defines them by what they feed, which is the right way round. The measure is then a fraction: of the fields that matter, how many have a written policy, an owner and a rule that is checked? I have argued that policy comes first because it is what makes a score possible (Keep the Policy, Keep the Score, Move the Council). This measure is that argument turned into a number. The ECB also expects named data owners for the critical elements and defined processes for remediating data quality problems, including "a root cause analysis" [8]. So the fraction counts more than fields on a list. It counts fields that have someone answerable for them.
The share of data that has been classified. Classification means each data set or field carries a label saying what it is and how it must be handled: personal, confidential, regulated, public. It is the precondition for most other controls, because a rule about personal data cannot be enforced on data nobody has marked as personal. It is also the measure tooling now helps with most. Microsoft's Purview data map, to take one widely used example, scans data and applies classifications automatically against rules the administrator configures [9].
The time to settle a contested definition. Every programme has arguments about what a word means: what counts as an active customer, when a product becomes discontinued, whose region a sale belongs to. I have argued that a council earns its keep by signing off proposed changes (Keep the Policy, Keep the Score, Move the Council), and survives only if it has reports it must read and decisions it must make (Give the Council Something to Decide). The elapsed time from a definition being disputed to its being settled and published is the plainest measure of whether that machinery works. The tools can put a timestamp on the end of it. In the glossary of Microsoft's classic Purview Data Catalog, a preview feature of a product that is in customer-support mode and no longer taking new customers, creating a term can be made to require approval, and "Non-approved glossary terms aren't saved in Purview catalog" [10]; the approval is the moment of settlement. The workflow starts only when someone submits a change for approval; the moment the dispute was first raised comes earlier, and the workflow is not described as recording it. My reading is that the council should log it, and report the median time to settle rather than the age of the oldest open dispute, for the same reason the backlog's oldest item is a poor measure: one dispute nobody can resolve would dominate it for years.
Error recurrence. My reading is that this is the one to watch most closely over the years. A programme that fixes an error and sees it again next month has fixed the symptom. I have argued that the correction belongs where the data is produced, and that a fix applied downstream is a patch (Two Models and a Seam). Recurrence is the number that tells you which kind of fix you made. ISO 8000-61, the international process model for data quality management, makes the same distinction in its introduction: correcting only the bad data has a limit, and it is when root causes are traced and corrected that "recurrence of the same type of data nonconformity can be prevented" [11]. Regulated manufacturing learned this long ago. A corrective action there is judged by evidence that it worked, and a problem that comes back is what sends an investigator to look at that evidence; the regulatory lawyers who review manufacturers' corrective-action files put the point bluntly about the paperwork of a closed action: "Those records show that an action was implemented. They do not show that it worked." [12]
What three of the four have in common is that none of them can be improved by the governance group alone, quietly, with one setting. A field gets under policy only when someone writes the policy and someone else accepts the owner's job. A definition gets settled only when the people who disagreed stop disagreeing. An error stops recurring only when the system or the team that produces it changes. The fourth, classification, is the exception, and the next section deals with it. The volume measures respond to the group's own configuration. These respond to whether the rest of the organisation has done what governance asked.
Where the honest four can lie too
I said these measures will not lie, and I want to test that, because a rule that has never been pushed on is only a preference.
The first test comes from my own words. When I called maturity models correct and oversold, part of the reason I gave was that people treat governance the way they treat everything else imposed on them: they click through the training and sign the policy without reading it (Rules of Decreasing Strictness). A policy that was signed and not read is still a policy, and the critical data element it covers still counts as under policy. My reading is that the first of my four can be inflated with paper. An owner can accept the job the same way, without reading what was accepted. The banking record shows a second way, through the denominator. McKinsey's study of banks implementing the Basel Committee's risk data principles, known as BCBS 239, found that "According to banks' own quantified self-assessments, overall compliance levels have actually declined since 2015" [13], and one of the reasons it gave was that banks had found gaps in coverage they had not known about [13]. In that case the list got longer as the banks learned more. My reading is that the same mechanism works in reverse: a coverage figure is only as honest as the list of what ought to be covered, and whoever writes the list can shorten it. The ECB's answer is to define the critical elements by what they feed and to require a validation function "independent from the units involved in data governance" [8]. That is the right answer, and it concedes the point: a coverage measure scored by the people it scores needs someone else to check the list.
The second test is classification, and here the objection lands hardest. Microsoft's guidance for automatic classification in its Purview data map lets the administrator set a custom classification rule's minimum match threshold, the share of a column's data that must match the pattern, anywhere "from 1% through 100%," suggests "at least 60%" to avoid false positives, and warns that "Unnecessary classification labels might look noisy and even misleading for data consumers" [9]. Microsoft's automatic sensitivity labelling, a separate mechanism that marks files rather than catalogued data, runs for SharePoint and OneDrive files at up to a "Maximum of 500,000 automatically labeled files in your tenant per day" [14]. Of the four, this is the one I read as most like the volume measures: a single policy, set by the governance group, can move it by a large amount in a day. What keeps it honest is checking a sample of the labels for accuracy, not just counting how many there are.
The third and fourth can be gamed by settling fast or by not counting. A definition nobody is allowed to dispute is settled instantly, a dispute that is never logged never ages, and a definition imposed by fiat closes the ticket without ending the argument. Regulated manufacturing knows the first failure well: the same lawyers name "closing a CAPA as soon as the listed tasks are complete" as one recurring issue in how corrective actions are closed [12]. An error that is reclassified as a new error each time it returns never recurs. Both of those require someone to suppress a signal that originates outside the governance group, which is harder than turning a dial, but not impossible.
So the claim worth defending is narrower than my answer, and my reading is that it is the better claim. No measure is immune. The volume measures are the ones the scored group can move by itself, in an afternoon, without anyone outside the group being involved or able to see it. Three of my four depend on someone outside the group: the owner who accepted the field, the business that raised the dispute, the user who reported the error. The fourth, classification, depends on someone checking a sample of its labels. My reading is that they are also stronger as a set than one at a time, because each catches the others' favourite lie. A critical element that is under policy and keeps throwing the same error is under a policy nobody follows. A definition that was settled in a day and keeps generating disputes and errors was settled badly. A high classification share with a poor sample accuracy is a bulk label. The set does not need an auditor to catch every game; it needs someone to read the four together. That someone has to sit outside the governance group, because the list of critical elements, the dispute log and the record of root causes are all kept by the group being scored. My reading is that the reader has to be a body the governance group answers to: the sponsor's steering committee, or a council whose members are not the group's own staff. A council made up of the group's own people does not count, however it is named. The section after next says why a council needs reports like these.
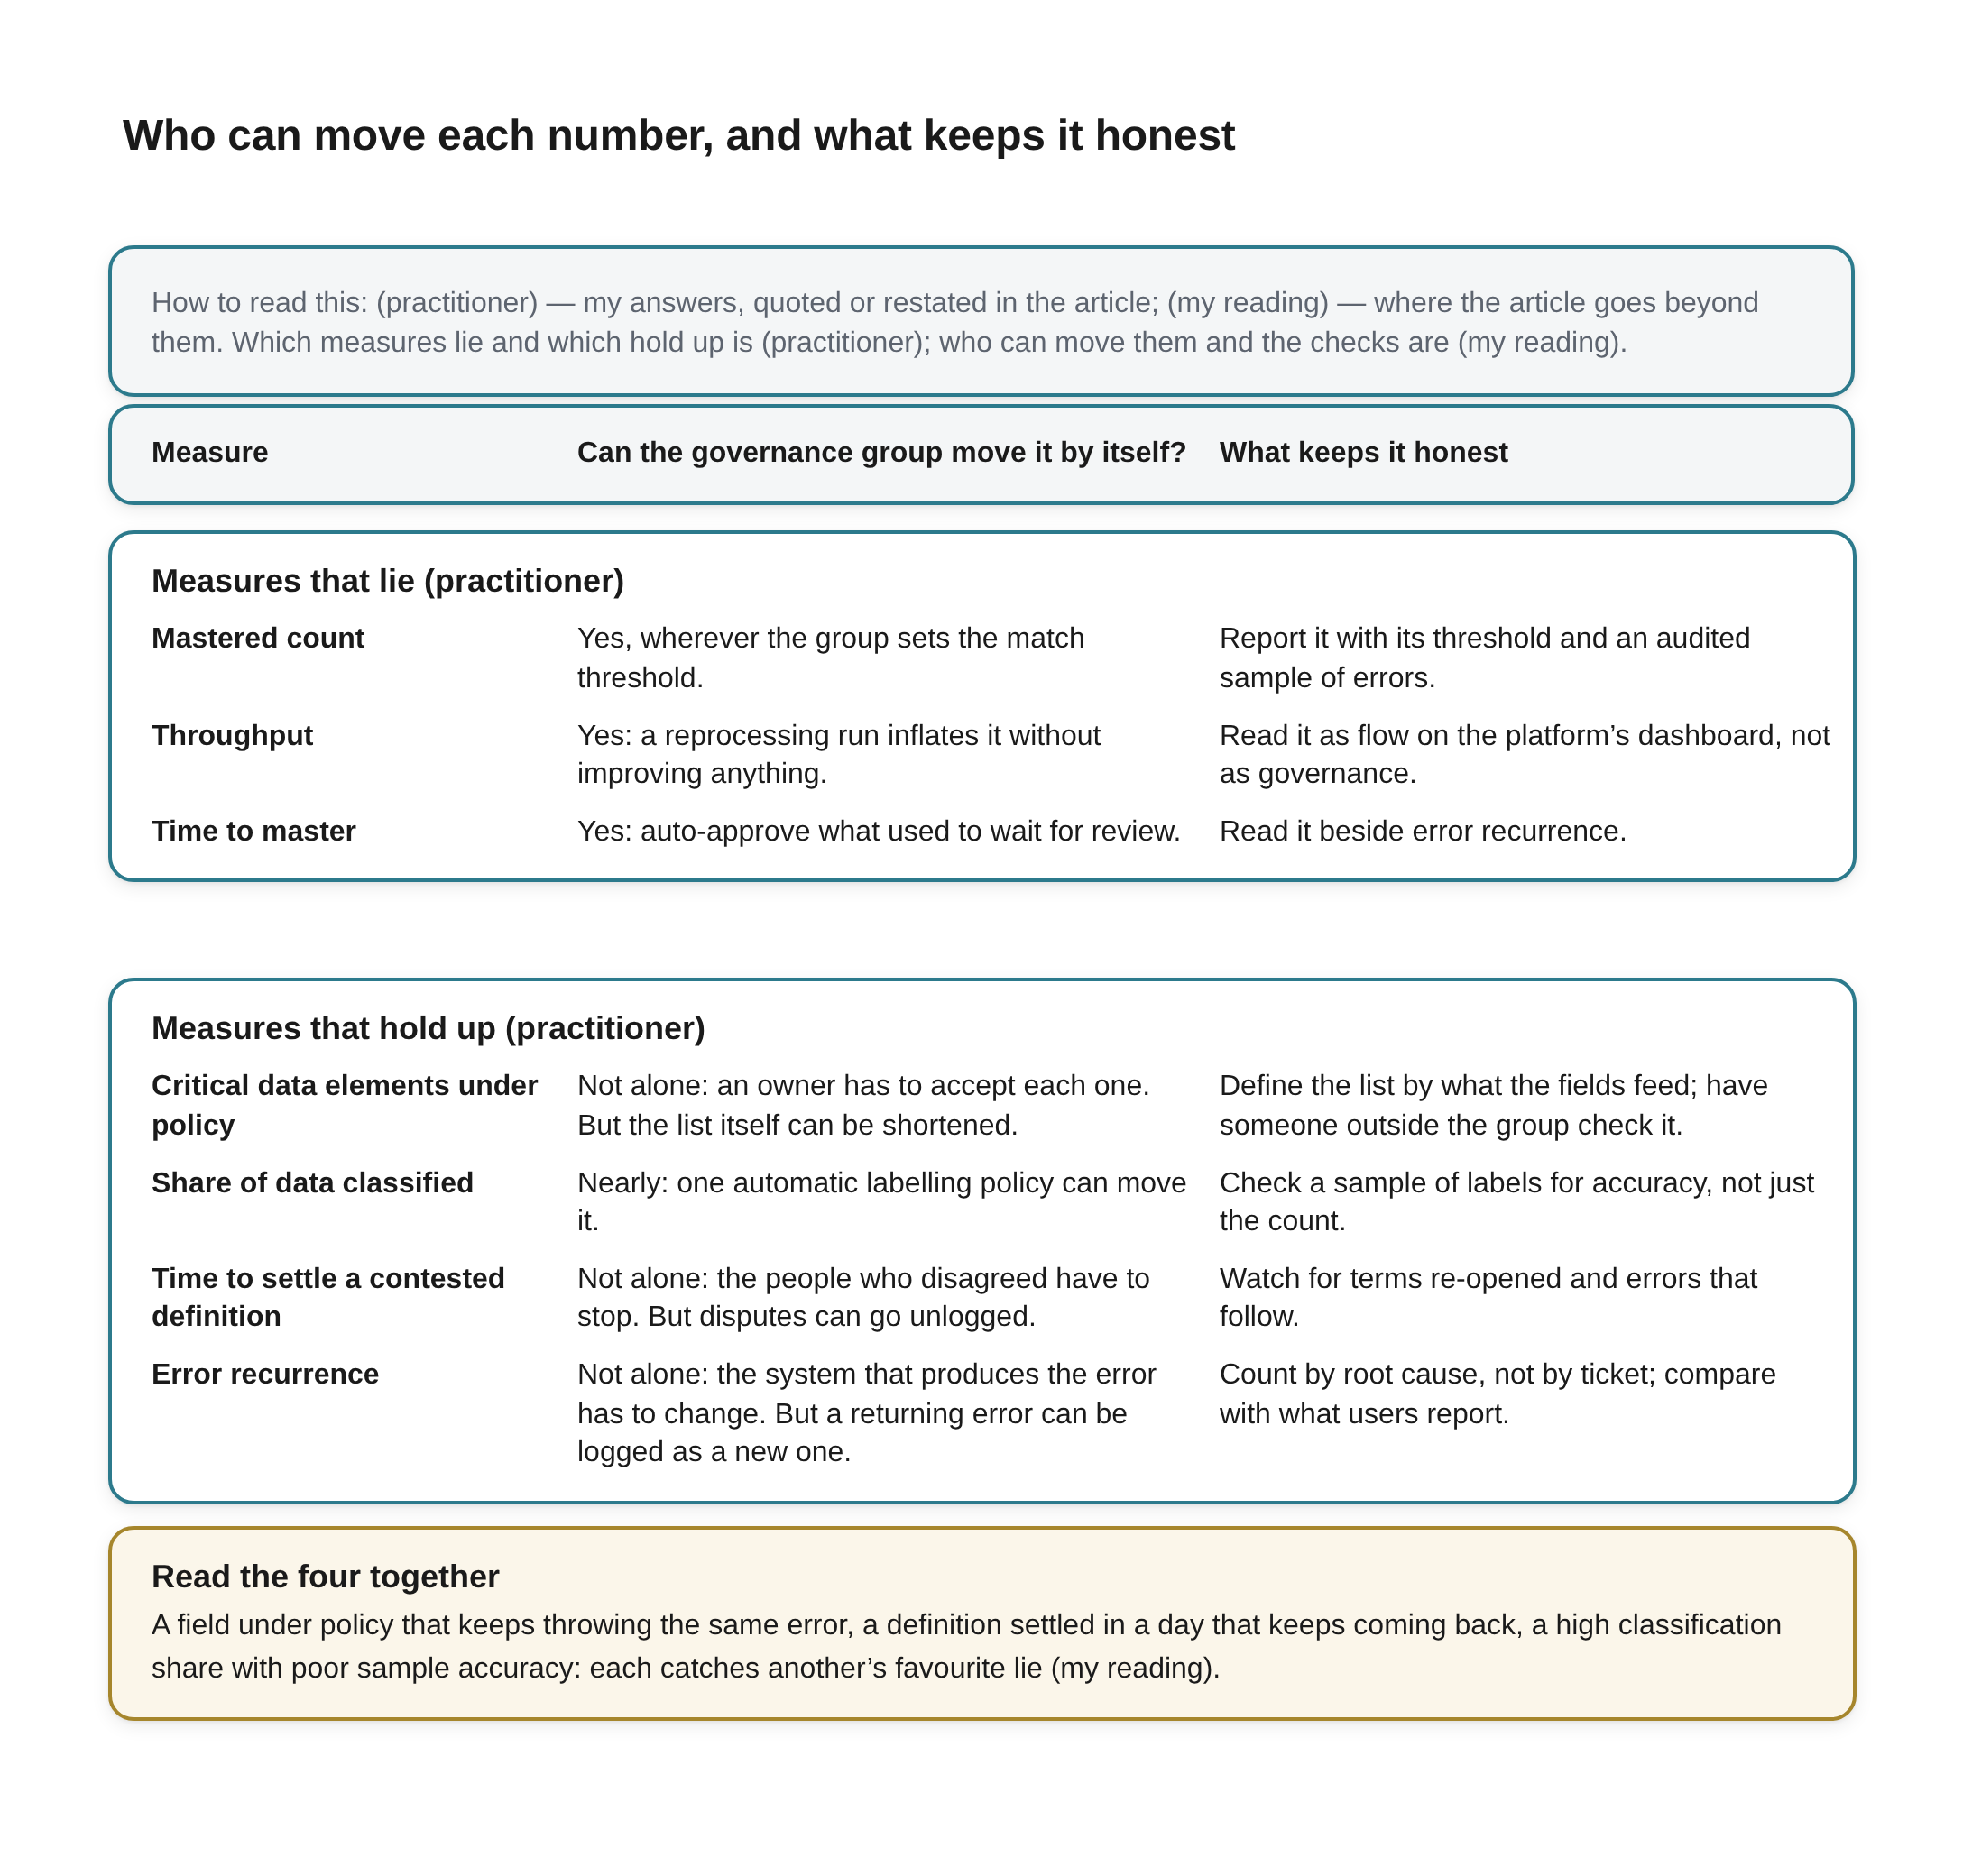
Who can move each number, and what keeps it honest Beneath the title a key reads: How to read this: (practitioner) — my answers, quoted or restated in the article; (my reading) — where the article goes beyond them. Which measures lie and which hold up is (practitioner); who can move them and the checks are (my reading).
A table with three column headings, Measure, Can the governance group move it by itself? and What keeps it honest, in two blocks.
Measures that lie (practitioner)
- Mastered count. Can the governance group move it by itself? Yes, wherever the group sets the match threshold. What keeps it honest: Report it with its threshold and an audited sample of errors.
- Throughput. Can the governance group move it by itself? Yes: a reprocessing run inflates it without improving anything. What keeps it honest: Read it as flow on the platform’s dashboard, not as governance.
- Time to master. Can the governance group move it by itself? Yes: auto-approve what used to wait for review. What keeps it honest: Read it beside error recurrence.
Measures that hold up (practitioner)
- Critical data elements under policy. Can the governance group move it by itself? Not alone: an owner has to accept each one. But the list itself can be shortened. What keeps it honest: Define the list by what the fields feed; have someone outside the group check it.
- Share of data classified. Can the governance group move it by itself? Nearly: one automatic labelling policy can move it. What keeps it honest: Check a sample of labels for accuracy, not just the count.
- Time to settle a contested definition. Can the governance group move it by itself? Not alone: the people who disagreed have to stop. But disputes can go unlogged. What keeps it honest: Watch for terms re-opened and errors that follow.
- Error recurrence. Can the governance group move it by itself? Not alone: the system that produces the error has to change. But a returning error can be logged as a new one. What keeps it honest: Count by root cause, not by ticket; compare with what users report.
A full-width box outlined in amber, headed Read the four together: A field under policy that keeps throwing the same error, a definition settled in a day that keeps coming back, a high classification share with poor sample accuracy: each catches another’s favourite lie (my reading).
What a maturity level is still for
None of this means throwing the maturity model away, and the strongest case for it deserves a hearing. Its proponents claim exactly what this piece is asking for. Melanie Mecca, who managed the CMMI Institute's Data Management Maturity programme, described the model as providing "a consistent and comparable benchmark to gauge progress over time" [15], and a DCAM assessment, run the way she describes it, is a facilitated session in which participants argue their way to a consensus score with evidence on the table [16]. The Basel Committee has tracked the largest banks against the BCBS 239 principles for years, and its 2023 report on 31 of them found that "Additional work is required at all banks to attain or sustain full compliance" [17], nearly a decade after the principles were published. A maturity scale scored by an independent party is a useful instrument.
The trouble is who usually holds the pen. In the same DCAM method, "The participants provide their opinion about which lifecycle stage the organization has achieved" [16]. A study of an IT maturity self-assessment at one organisation, by Björn Johansson and colleagues, found that in the people dimension of the processes it examined the survey score came out "almost one maturity level higher" than the interviews supported, and that "There is a tendency to score maturity higher than it actually is" [18]. It is one organisation and not a data governance programme, and the authors themselves suggest complementing such a self-assessment with other methods, but my reading is that the direction is the one a self-scored workshop would predict. And the banks' own numbers in McKinsey's study moved downward as they learned more [13], which means a self-score tracks what the scorer knows as much as how good the programme is.
My reading is that a maturity model is a map and the four measures are an odometer. The map tells you what a mature programme has: a policy framework, owners, a glossary, controls, a way to settle disputes. It is the right checklist when a programme is being designed, and it is the right frame for an independent review. It is the wrong thing to score a programme by from one quarter to the next, because the level is a judgement about capability, it is usually the programme's own judgement, and it moves in big steps that can be argued for. The odometer tells you whether the capability is being used. Policy-first, which I have defended, is the reason both can exist: the policy is what the map describes and what the odometer counts against (Keep the Policy, Keep the Score, Move the Council).
No study that tests governance measures against each other turned up in the research for this piece: nothing that follows programmes over years and asks which numbers predicted that the data actually got better. A 2025 study of data governance by Matthias Schmuck and Radu Mircea Georgescu still lists "the measurability and operationalisation of data governance initiatives" as a matter needing research [19]. So I will not tell you that these four are proven. I will tell you that they are harder for the people being measured to move quietly by themselves than the volume numbers are: three need someone outside the group, and the fourth needs its labels checked.
Year one and year three
The question asked for measures after the first year and after the third, and I gave one list, not two. Asked whether that was deliberate, I said it was:
Yes, the same four. Metrics changing over time indicates maturation of the system. If you track different metrics at different times they're not going to tell you as much as they would if you tracked the same metrics over the same period.
That answer is also the best reply I have to the maturity model. On this account, maturing is not a level the programme is awarded. It is the movement of the same few numbers over the years, read as change over time from as far back as there is history, the way I read the flow measures on the platform side (Proving the Platform Is Delivering). Change the measures every year and you lose the one thing that makes them worth having: a run long enough to show a trend. My reading is that the same four will not all have much to say at first. The share of critical data elements under policy and the share of data classified can move in the first year, because they depend mostly on the programme writing things down and getting owners to accept them. Time to settle a definition needs disputes to have happened, so it has few readings early on and means more as the backlog of arguments builds and gets worked. Error recurrence needs the longest history of all, because an error has to be fixed before it can come back, and the useful reading is the trend over many fixes. A programme that reports strong recurrence figures after six months has not had time to earn them.
That also suggests what to put in front of the council. I have argued that a council persists only on reports it is required to read and decisions it is required to make (Give the Council Something to Decide). These four are the governance group's reports. The flow measures belong to the platform team, read on their own dashboard. Put the two on one slide and the mastered count will take the headline, because it is the biggest number and it usually goes up.
Mirror finish
The question asked which measure lies most easily, and the answer turned out to be less about honesty than about leverage. A number lies easily when the people it judges are the people who produce it, and in master data the headline numbers, how many records were mastered and how fast, are produced by the governance group's own match rules. That is how a programme ends up with a mirror finish: every dashboard bright, every count improving, and underneath it customers merged into strangers or listed three times over.
The measures that hold up are the ones that need somebody else to move them, or, in the case of classification, somebody else to check them. A field under a policy its owner accepted, a definition the people who disputed it can live with, an error that stopped coming back because the system that produced it was fixed. They are slower and harder to collect, error recurrence may need root-cause tagging a programme does not yet have, and they rarely make a good slide. Read together, by someone outside the group that keeps them, they are the ones that tell you whether the governance worked, rather than how much passed through it.
References
[1] Ivan P. Fellegi and Alan B. Sunter, "A Theory for Record Linkage," Journal of the American Statistical Association 64, no. 328 (1969): 1183–1210. Read in full 2026-11-08 from a scanned copy in which some symbols are illegible. https://www.cs.cornell.edu/~shmat/courses/cs6434/fellegi-sunter.pdf
[2] UK Ministry of Justice, "Documentation for splink.clustering" and the tutorial "Predicting which records match," Splink documentation. Both read in full 2026-11-08. Cited for how a match threshold decides which pairs are joined into clusters. https://moj-analytical-services.github.io/splink/api_docs/clustering.html
[3] Olivier Binette and Rebecca C. Steorts, "(Almost) all of entity resolution," Science Advances 8 (2022), eabi8021, doi:10.1126/sciadv.abi8021. Read in large part (about the first two-thirds) 2026-11-08 from the arXiv version. https://arxiv.org/abs/2008.04443
[4] Informatica, "View key job metrics," Informatica Intelligent Cloud Services, Business 360 (master data management) documentation. Read in full 2026-11-08. Cited for what the product reports; the product is not assessed. https://onlinehelp.informatica.com/IICS/dev/b360/en/kk-b360-monitor-jobs/View_key_job_metrics.html
[5] AssessTEAM, "Master Data Management KPIs List," last modified 24 December 2024. Read in full 2026-11-08. A published KPI list, cited as an example of practice, not as research. https://www.assessteam.com/master-data-management-kpi-list/
[6] Matt Barnes, "A Practioner's Guide to Evaluating Entity Resolution Results" (title as published), Carnegie Mellon University, 2014, arXiv:1509.04238. Read in full 2026-11-08. https://arxiv.org/abs/1509.04238
[7] Marilyn Strathern, "'Improving ratings': audit in the British University system," European Review 5, no. 3 (1997): 305–321. Read in full 2026-11-08. https://www.cambridge.org/core/journals/european-review/article/improving-ratings-audit-in-the-british-university-system/FC2EE640C0C44E3DB87C29FB666E9AAB
[8] European Central Bank, Banking Supervision, "Guide on effective risk data aggregation and risk reporting," May 2024. Read in full 2026-11-08. https://www.bankingsupervision.europa.eu/ecb/pub/pdf/ssm.supervisory_guides240503_riskreporting.en.pdf
[9] Microsoft, "Classification best practices for Microsoft Purview Data Map," Microsoft Learn. Read in full 2026-11-08. Cited for what the product's documentation says; the product is not assessed. https://learn.microsoft.com/en-us/purview/data-gov-best-practices-classification
[10] Microsoft, "Business terms approval workflow," Microsoft Purview Data Catalog (classic) documentation, Microsoft Learn; the feature is marked as in preview. Read in full 2026-11-08. https://learn.microsoft.com/en-us/purview/how-to-workflow-business-terms-approval
[11] International Organization for Standardization, ISO 8000-61:2016, "Data quality — Part 61: Data quality management: Process reference model." Preview pages only (introduction and contents) read 2026-11-08. https://webstore.ansi.org/preview-pages/ISO/preview_ISO+8000-61-2016.pdf
[12] Jodi Scott and Mike Heyl, "Closing the CAPA is not closing the loop," Hogan Lovells Cadwalader (hlc.com), 7 October 2026. Read in full 2026-11-08. A law-firm briefing on corrective and preventive actions in regulated manufacturing. https://hlc.com/en/publications/closing-the-capa-is-not-closing-the-loop
[13] Holger Harreis, Tony Ho, Jorge Machado, Peter Merrath, Kayvaun Rowshankish and Asin Tavakoli, "Living with BCBS 239," McKinsey & Company, May 2017. Read in full 2026-11-08. A consultancy survey, not peer-reviewed. https://www.mckinsey.com/~/media/McKinsey/Business%20Functions/Risk/Our%20Insights/Living%20with%20BCBS%20239/Living-with-BCBS-239.pdf
[14] Microsoft, "Automatically apply a sensitivity label to Microsoft 365 data," Microsoft Purview documentation, Microsoft Learn. Read in large part 2026-11-08. The daily cap applies to SharePoint and OneDrive files. https://learn.microsoft.com/en-us/purview/apply-sensitivity-label-automatically
[15] Ben Linders, "Improving Data Management with the DMM," interview with Melanie Mecca, InfoQ, 15 September 2014. Read in full 2026-11-08. The programme's own account of what it measures. https://www.infoq.com/articles/improving-data-management-DMM
[16] Melanie Mecca, "Data Professional Introspective: Conducting a DCAM Assessment," TDAN.com. Read in full 2026-11-08. https://tdan.com/?p=30968
[17] Basel Committee on Banking Supervision, "Basel Committee report on implementing Principles for effective risk data aggregation and reporting shows progress made but significant work still remains," press release, Bank for International Settlements, 28 November 2023, on the report "Progress in adopting the Principles for effective risk data aggregation and risk reporting." Press release and the report's summary page read 2026-11-08; the full report could not be reached. https://www.bis.org/press/p231128.htm
[18] Björn Johansson, Jessica Eckerstein and Jacob Malmros, "Evaluating a quantitative IT maturity self-assessment approach: Does it give a good way of the as-is state?", 4th International Conference on Management, Leadership and Governance (ICMLG), 2016. Read in full 2026-11-08. One organisation; IT service management, not data governance; the comparison is with interviews. https://lup.lub.lu.se/search/files/7577814/ICMLG_paper.pdf
[19] Matthias Schmuck and Radu Mircea Georgescu, "Enablers of Effective Internal Data Governance: A Performance-Oriented Analysis," Economic Computation and Economic Cybernetics Studies and Research 59, no. 4 (2025). An empirical study (literature review, 15 expert interviews, a survey with 273 complete responses, of which the 145 from European participants were analysed). Read in full 2026-11-08. https://ecocyb.ase.ro/nr2025_4/7_MathiasSchmuck_RaduMirceaGeorgescu.pdf