Proving the Platform Is Delivering: Read It as a Flow, Not a Finish Line
Weaving Intelligence (House AI Style), with Jeff Shabel’s Experiential Commentary
When a client asks me to prove that the master data platform is delivering, the answer I give is a simple one, and it comes with a condition. The measure is three numbers. The condition is that the measure does not exist until the platform does: the inflow can be counted from the sources beforehand, but the mastered count and the score of what was mastered cannot, and without them the inflow measures demand, not delivery. Treating an estimate made before the system exists as though it were a measurement taken by the system is how a sound programme gets judged against a figure nobody could have known.
That puts this piece at an angle to most of what is written about proving the value of master data management. The usual advice is to fix a baseline before you start and to tie the programme to business outcomes from the first day. Some of that I agree with, and the part about the business's own numbers an earlier piece in this publication has argued: a funding case should name the downstream figure it means to move, and write down what it reads before anything is built, because an asset value is not a return (An Asset Is Not a Return). This piece is about a different question, which comes later. The platform is in. Money has been spent on it. Is it doing what it was bought to do? A sponsor who asks that usually means money, and the money belongs to the business case. What the platform can show about itself is a history, and the value is in the history, not the level. A single reading of any of its numbers says almost nothing; the same reading set against last month's says most of what a sponsor needs to know.
Here is the narrow claim I will defend. Whether a master data platform is delivering is shown by what flows into it and out of it, read as change over time once it is running. It is not shown by a percentage that is supposed to reach a hundred, and it cannot be shown in advance, because before the platform exists the only thing you can measure is how much data is headed for it. Everything else said before go-live about flows and duplicates is a rough order of magnitude, a ROM, and should be labelled as one.
Two counts and a score
The platform I have in mind is the one I deploy, so a disclosure before I go further. The practice behind this publication is a Profisee partner. Clients pay us for deployment work, a licence sale we refer earns us a referral fee from the vendor, and our services revenue depends on this category being bought at all. Crediting the platform sells the platform, so that interest runs toward praise of Profisee and of the category: weigh what I say in their favour below my criticism of them. Two of the sources below come from vendors that compete with Profisee, CluedIn and Informatica, and there the interest runs the other way: discount any criticism of them here, and check it against what they say themselves. Nothing in this piece is a review of a Profisee feature. Where I name what the product does, I name it from Profisee's own pages and cite them.
The measure itself is deliberately plain:
I measure number of source records in, by source, number of Mastered records and score the ‘value’ of the Mastered records by their completeness. I compile these metrics on an entity-by-entity basis, an aggregate report for the entire system and targeted reports for specific entities of greater concern to the business—Customer, Employee, Item, etc. It’s a simple metric, but it provides a concise summary of how things are working and how well data is flowing into and out of Profisee.
The three numbers do three different jobs. Source records in, broken down by source, is the inflow: how much is arriving and from where. The count of mastered records is what the platform has produced from that inflow: the records that now stand for one customer, one employee, one item, after matching and survivorship have done their work. That count is read against the inflow, never on its own, and a falling count is not automatically good news: overmatching makes it fall too. Errors usually show up as exceptions: records the rules flag and hold for a steward. Overmatching, though, is the measure's blind spot, and it should be said plainly: an overmatch is a confident automatic decision, so it never enters the steward queue as actionable, and none of the error counts can see it. It surfaces when stewards find the overmatches at reconciliation, as the section on a hundred percent below describes. The completeness score is a judgement of quality on what was produced. Completeness has an advantage worth naming: it can be read off the records themselves, without anyone first having to agree what "accurate" means for every attribute. The data quality profession defines the dimension the same way. The DAMA UK working group calls completeness "the proportion of stored data against the potential of '100% complete'" and measures it by "the absence of blank (null or empty string) values or the presence of non-blank values" [1]. The UK government's Data Quality Hub adds the qualification that matters for how the score is read: data is complete "when all the data required for a particular use is present and available to be used," and "it's not about ensuring 100% of your data fields are complete" [2]. That is why the score belongs on the mastered record and not the source row. The question is whether the record the business uses has what the business needs, not whether every column in every feed was filled. The use has to be named entity by entity, which is a smaller agreement than defining accuracy for every attribute, and the targeted reports are where it is worth naming first.
The cuts earn their places separately. Entity by entity, because a customer master and an item master fail in different ways and averaging them hides both. One report for the whole system, because a sponsor needs one page. And targeted reports for the entities the business cares about most, because those are the ones a sponsor will be asked about by somebody else.
There are no thresholds here, and none should be invented: a target completeness score offered without knowing what the entity is for is a guess. The numbers earn their meaning in comparison, which is the other half of the answer.
The value is in the deltas
The measure only means something as a history:
As for when, ideally as far back into history as we can go. The value of the metrics is deltas over time. Having a longer history allows us to examine not only the value being brought to the business, but the overall health of the system and the data flowing through it.
Value can be determined in much the same way for any fluidic system. You look for peaks and troughs, spikes, clean flow and quality of what’s flowing through. History provides additional value in that trends can be tracked and needed changes can be anticipated.
A master data platform behaves like anything a fluid passes through, and that gives you a vocabulary for reading it that a single number cannot. A peak in source records in on the day the weekly load arrives is the platform doing its job. A trough where a source used to feed steadily is a question for whoever owns that source. A spike in records arriving with blank attributes says something changed upstream before anyone sends an email about it. And a flat line in the mastered count while the inflow climbs is a question, not an answer. The by-source breakdown says which question it is. If the extra inflow is a known source reloading records the platform has already mastered, a flat count is the matching doing its job. If it is new records, look at the steward queue. A growing queue means the backlog is with the stewards. A short queue with the count still flat means the new records are either landing on existing masters, which is right only if they really are duplicates and is overmatching if they are not, or are not reaching matching at all. Stewards' reversals tell the first apart, and the load logs tell the second.
None of that can be read from one snapshot. The NIST/SEMATECH handbook of statistical methods states the premise in one sentence: "The underlying concept of statistical process control is based on a comparison of what is happening today with what happened previously" [3]. Read that way, a number that moves is not by itself a fault; what matters is how it moved against what came before, which is why I ask for as much history as can honestly be had, on the terms the next section sets out.
The case I would put to a sceptic is a morning, not a quarter:
At one client, we had reports that automatically run in the morning during ingestion and they flag irregularities and anomalies. This allowed the monitoring team to identify and correct a systemic error with the source data before the end users started their day.
Having the reports was the smaller half of it:
Having and, more importantly, monitoring these reports--which means tying notifications to them--allows for immediate intervention when data moves outside of the acceptable band. In some cases, this allows the team to correct those issues before the data makes it down into the reporting systems utilized by the end users.
Read with the handbook's premise, that is a comparison with what came before, delivered to someone who could act while the data was still on its way. "The acceptable band" is the rule for when a move matters, and it names no number; read the same way, it is best set from what the history has shown to be normal.
A sceptic will say that morning was pipeline monitoring, not master data management. The split does not hold:
Pipeline feeds the MDM reports which, being set up correctly, are automated and generate automated reports. MDM is a part of the pipeline that's being conducted by a specialized tool. That's why it's both Capital and Operational.
The morning reports were MDM reports, fed by the pipeline MDM is part of; that is also why MDM's cost sits in both budgets (Both and Neither).
Before the platform exists
A measurement needs a thing to measure and an instrument to take it with, and before go-live the platform is neither. The mastered count cannot be read before anything has been mastered, and the completeness of mastered records cannot be scored before there are any.
The inflow is the one count with a life before go-live, and it needs stating exactly. What can be backfilled is a count of source records by creation date in the systems that will feed the platform. It often cannot be backfilled by change date, because many legacy systems keep only a record's latest change—specifically those with Type-1 fields that don’t also implement audit tables. Even by creation date, it misses records since purged or archived, so the older periods read low. That is a proxy. The flow as the platform will actually receive it depends on things that do not exist yet: how loads are scheduled, what is filtered at intake, integrations not yet built, and the duplicates inside each feed. That flow stays a rough order of magnitude. The two series join at go-live, and only from then is the inflow a reading by the platform's own instrument.
Before go-live there is exactly one thing to measure, and it is not the platform:
The only thing available to be measured before the existence of the system is the scope of the data being fed into the system. While that has some obvious bearing on system sizing, flows can only be estimated based upon White Papers, Case Studies and other systems which, while providing a range, aren't necessarily accurate. It's a ROM, not a detailed estimate.
The duplicates are where the case for measuring first breaks down:
Further, if it were possible to comprehensively measure the duplicates before MDM system was in place, there would be no need for the MDM system as whatever system was being used to measure the duplicates could be used to deduplicate the data set at the same time.
Pre-implementation data profiling is recommended practice across the field, and duplicates are one of the things it is recommended for. Informatica's implementation methodology calls data profiling "a fundamental activity performed in the early phase of a Data Management project," cites the discovery of "duplication, lack of consistency and lack of accuracy and completeness," and says profiling "identifies problematic 'hot spots' early in the project" [4]. Dun & Bradstreet's editors put it as a precondition: "Before loading data into an MDM system, teams need to understand the condition of their source data," and "data profiling surfaces missing values, inconsistent formats, and duplication across systems" [5]. Eric Melcher, writing as Profisee's chief technology officer on measurement as a pillar of strategy, told readers to "start by reiterating the problem you want to solve and the cost of that problem in your current state," and warned that "if you don't know how much time someone spends cleansing records every week, then it's very hard to know if you adjusted your data matching strategies in the right way" [6]. Read quickly, all three say measure before.
Read carefully, none of them contradicts the precondition, and the reason is the word "comprehensively." Two different things are being measured before go-live in that advice, and neither is the platform's delivery.
The first is the business's own number. The time someone spends cleansing records every week exists before the platform does, because the person and the week exist. That is the downstream figure, and recording it before the build is exactly what that earlier piece argued a funding case should do. It is not a reading of the platform, and it will not tell you, after go-live, whether the inflow is healthy or the mastered count is keeping up.
The second is profiling, and profiling estimates. Arvid Heise, Gjergji Kasneci and Felix Naumann set out in 2014 to estimate "the number and sizes of duplicate record clusters in advance," and their method is sampling-based [7]. They state the difficulty that makes sampling necessary: "if done in a simplistic way, the estimation of the cluster sizes may be as expensive as the retrieval of the duplicates itself," so any useful estimator "would have to run much faster than any duplicate detection algorithm on the same dataset" [7]. Their stated aim is to give users "a means for quickly calculating approximate statistics" [7]. That is the paradox in a computer scientist's words. The exact count costs what the deduplication costs, so the only affordable count before the system exists is an approximate one. The data quality dimension makes the same point from the other side. DAMA UK's measure of uniqueness is "the number of things as assessed in the 'real world' compared to the number of records of things in the data set" [1]. The number of real-world things is precisely what a master data platform exists to establish. Until something has matched the records, nobody knows it.
So profiling before go-live is worth doing, and nothing here argues against it. What it yields about duplicates and flows is a ROM, and the ROM is useful. What it does not yield is a baseline the platform can later be held to, because the platform's own count will come from rules tuned against stewards' decisions that the profile never saw. A comprehensive pre-platform count of duplicates would have been the deduplication itself.
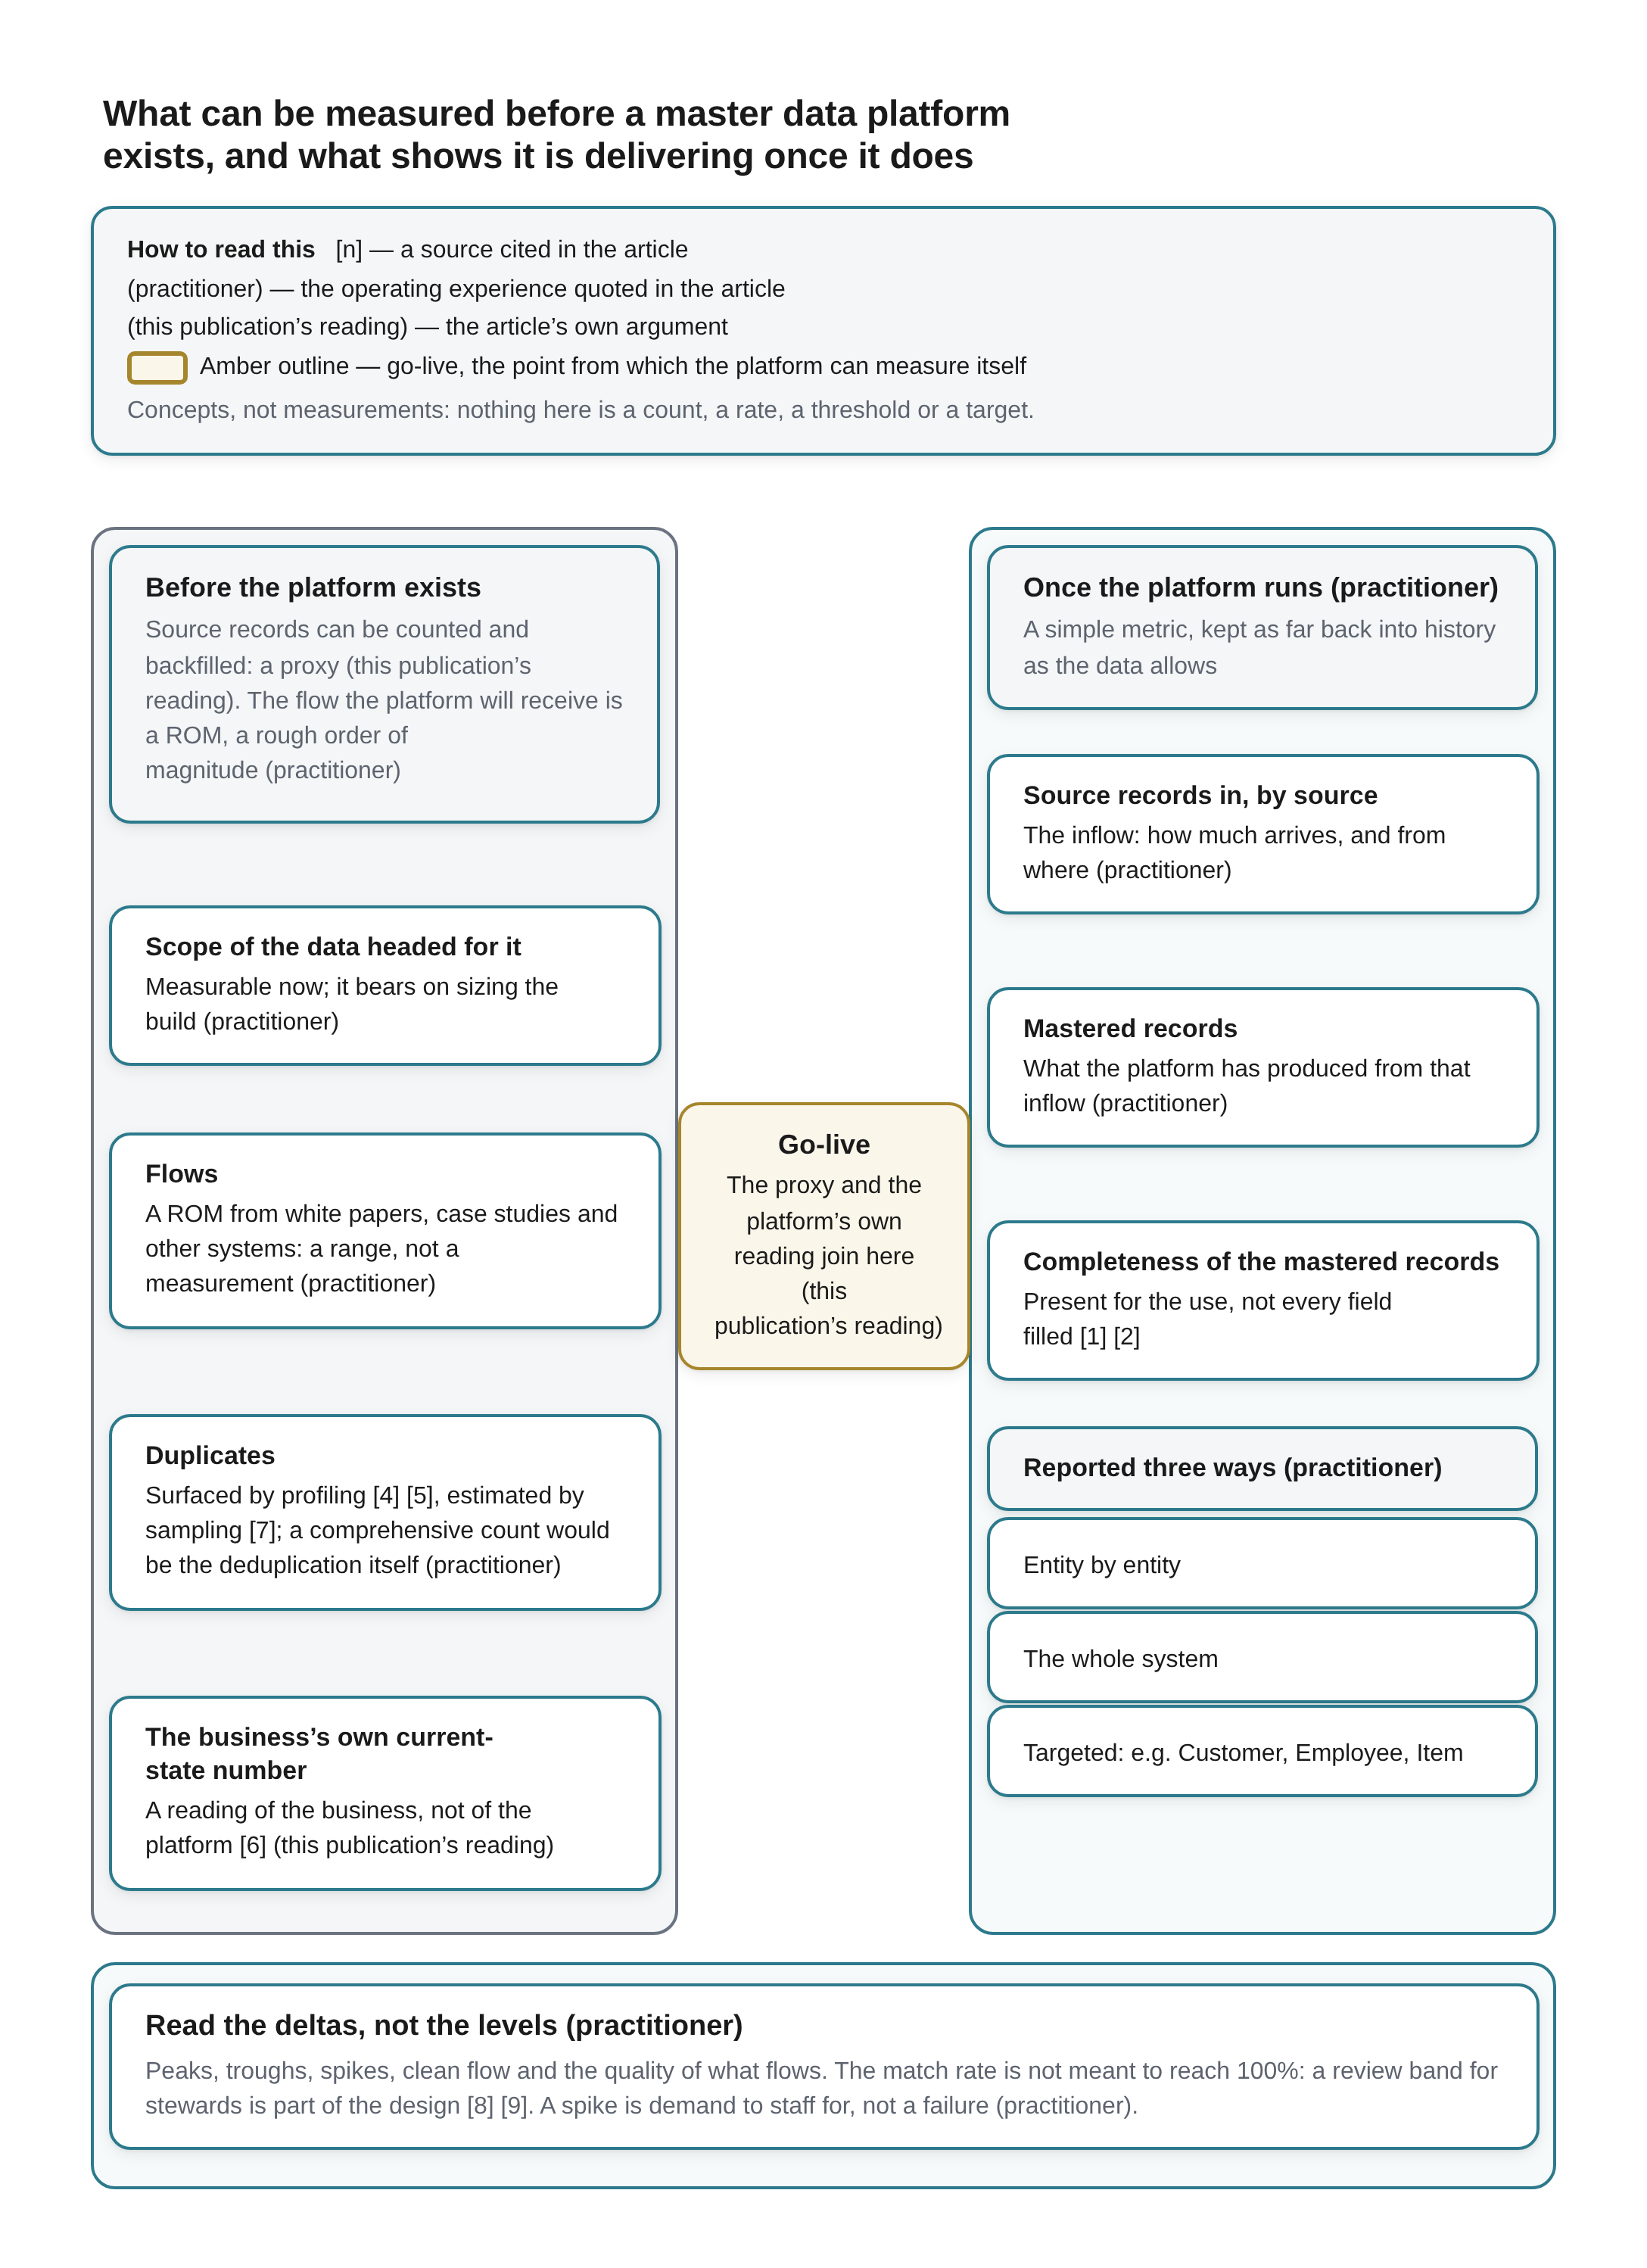
What can be measured before a master data platform exists, and what shows it is delivering once it does Two columns either side of a go-live marker. A key across the top reads: How to read this [n] — a source cited in the article; (practitioner) — the operating experience quoted in the article; (this publication’s reading) — the article’s own argument; Amber outline — go-live, the point from which the platform can measure itself. Concepts, not measurements: nothing here is a count, a rate, a threshold or a target.
The left column is headed Before the platform exists — Source records can be counted and backfilled: a proxy (this publication’s reading). The flow the platform will receive is a ROM, a rough order of magnitude (practitioner). It holds four cards: Scope of the data headed for it (Measurable now; it bears on sizing the build (practitioner)), Flows (A ROM from white papers, case studies and other systems: a range, not a measurement (practitioner)), Duplicates (Surfaced by profiling [4] [5], estimated by sampling [7]; a comprehensive count would be the deduplication itself (practitioner)) and The business’s own current-state number (A reading of the business, not of the platform [6] (this publication’s reading)).
Between the columns, outlined in amber and spanning the gap so that it touches both column frames, the marker Go-live: The proxy and the platform’s own reading join here (this publication’s reading).
The right column is headed Once the platform runs (practitioner) — A simple metric, kept as far back into history as the data allows. It holds three cards: Source records in, by source (The inflow: how much arrives, and from where (practitioner)), Mastered records (What the platform has produced from that inflow (practitioner)) and Completeness of the mastered records (Present for the use, not every field filled [1] [2]). Beneath them, under the heading Reported three ways (practitioner), three rows: “Entity by entity”, “The whole system” and “Targeted: e.g. Customer, Employee, Item”.
The closing band: Read the deltas, not the levels (practitioner). Peaks, troughs, spikes, clean flow and the quality of what flows. The match rate is not meant to reach 100%: a review band for stewards is part of the design [8] [9]. A spike is demand to staff for, not a failure (practitioner).
A hundred percent of anything
The measure has one more enemy, and it is the reading a buyer brings to it. The constant struggle with this measure is that it never finishes:
I’ve had several client raise concerns over the lack of 100% accurate matching or 100% population or 100% of anything. It’s a constant struggle to convince customers that Mastering data is a process that doesn’t complete and that there are natural ebbs and flows of the data quality within the system.
That is not a charge against any particular figure a platform reports. It is about the expectation the figure is read against.
The theory of record linkage agreed before anyone sold a master data platform. In the model Ivan Fellegi and Alan Sunter set out in 1969, as William Winkler summarised it for the U.S. Census Bureau, every candidate pair falls into one of three bands: a match, a non-match, or a band between, where the pair is designated "a possible match" and held "for clerical review" [8]. Winkler calls the middle band "the no-decision region or clerical review region" [8]. A matching process with a review band built into its mathematics is not designed to reach a hundred percent automatically, and the same overview notes that estimating matching error rates is a research problem "still open because the current methods only apply in a narrow range of situations" [8]. Profisee's own page on its matching says the same thing in a vendor's vocabulary. It describes "an ML-powered matching engine to automatically match duplicate records" and, in the next breath, keeping "a human in the loop for manual review of inconclusive results" [9]. The inconclusive band is part of the design.
Forcing that band closed is how the trouble starts. On the first day the rules decide some share of the candidate pairs automatically and hold the rest for review, and the temptation is to push the held share into the automatic box by loosening the rules. What that produces, in my experience, is records merged that should never have been merged, stewards working late to unpick them, and the bill arriving at the first quarterly reconciliation, when someone has to explain the overmatches and the allocations built on them. An earlier piece in this publication argued where that date belongs on an implementation plan (Time-to-Value Is Not Your Date). A match rate held below a hundred on purpose is the platform working. A match rate driven to a hundred by loosening the rules is a liability with a good-looking number on it.
Population is the same: "assessing data quality is an on-going process; measure the quality of your data regularly as data can change over time" [2]. New records arrive incomplete, sources change their formats, an acquisition brings a system that never captured the attribute you score on. The completeness score will ebb when that happens and flow back as stewardship catches up. Completeness differs from the match rate in one respect. A score of a hundred on the attributes a use requires is possible, and an entity may reach it; it will not survive the next new source, so it is a reading to expect to lose, not a goal to hold. A sponsor who has been told to expect that reads the ebb as a load arriving. A sponsor who was promised a hundred reads it as the platform failing, and starts the conversation I have had with several clients.
Run it all through AI
The newer version of the hundred-percent expectation arrives with a proposed fix, and the fix is the problem:
Another, more ‘modern,’ challenge is the temptation to ‘run all the data through AI’ to Master it. The manual review process undertaken by Data Stewards is core and important to achieving quality data as I’ve yet to see a cost-effective AI system that can review and correct data as accurately as a Data Steward with relevant domain knowledge.
I hold to both qualifiers in that, and the case against me is strong, so here it is first.
Language models match records well. Ralph Peeters, Aaron Steiner and Christian Bizer tested them on standard entity-matching benchmarks and report that "the best LLMs require no or only a few training examples to perform comparably to PLMs that were fine-tuned using thousands of examples," and that they are more robust to entities they have not seen [10]. On annotation work more generally, Fabrizio Gilardi, Meysam Alizadeh and Maël Kubli found that "the zero-shot accuracy of ChatGPT exceeds that of crowd-workers for four out of five tasks," that its intercoder agreement exceeded that of both crowd-workers and trained annotators, and that its per-annotation cost was "about twenty times cheaper than MTurk" [11]. The vendors have built on it. CluedIn describes AI agents in master data stewardship and cites a customer that moved from a full team to one person overseeing roughly ten million records a day [12]. Profisee's AI assistant, Aisey, is described on Profisee's site as letting stewards "review match proposals, apply survivorship rules and interrogate records for violations or let those tasks run autonomously," with agent templates including "Propose Matches" and "Apply Match Survivorship" [13]. The direction of the industry, the vendor we partner with included, is toward more of the stewardship being done by machines.
None of it contradicts what I said, and the reason is in what each source compared. Peeters and his colleagues compare language models with other trained models on product and bibliographic benchmarks, not with stewards correcting a company's master records. Gilardi's comparison is with crowd-workers and research assistants labelling tweets, which is cheap human labour on a task that needs no knowledge of the business. The CluedIn piece offers its staffing example but no comparison of accuracy between its agents and the stewards they replaced; its suggested measures are approval rates, false merges and reversals, and it says plainly that the outcome "is not stewardship without humans" [12]. Profisee's own page keeps the human for what matters: Aisey works "automating where possible, escalating where human judgment is essential," and "every change is reviewable" [13]. The vendors building the autonomy still route the hard cases to a person, and the hard cases are what a steward with domain knowledge is for. I went looking for a study that compares AI correction of master records with the corrections a domain-knowledgeable steward makes, at stated cost. I did not find one. Until one exists, "yet to see" stands as I said it, and I will not widen it into "cannot."
The cost condition cuts both ways, which is the part the "run it all through AI" proposal tends to miss. Peeters and his colleagues are explicit that the cost of a hosted model "is dependent on the length of the respective prompts, measured by the amount of tokens," and that the in-context learning and rule-based approaches increase the cost "by 1.5 to 470 times" against zero-shot use of the cheapest hosted model they priced [10]. A master data platform touches every record. I have been in discussions about limiting how much a master data programme uses AI for exactly that reason: it touches so many records that applying a model to all of them would exhaust the budget for tokens. The argument runs the other way as well. Deduplicating at the batch and at the source reduces the number of records sent to whatever AI process sits downstream, which makes the platform a way of spending fewer tokens rather than a reason to spend more. Running all the data through AI to master it inverts that: it pays the per-record price on the very duplicates mastering exists to remove.
What shows up first when it works
From here the warrant changes, from what the sources show to what my own record shows, stated as pattern rather than law.
The first sign that a platform is working is not on anybody's scorecard:
Idle resources. When MDM and Profisee are working correctly and efficiently, the overall workload drops significantly. This tends to bring a false sense of security to clients and they’re eager to reassign or re-task the ‘idle’ resources.
The challenge is making sure they’re aware that MDM systems tend to have spike demands and sufficient elastic bandwidth needs to be available to address them when they occur. This tends to happen when weekly data loads occur, new systems integrate or upstream systems expand their volume.
The flow measure itself shows why acting on that in a hurry is a mistake. The weekly load is a peak every week. A new source system integrating is a step change in source records in. An upstream system that doubles its volume doubles the inflow without anyone in the master data team having asked for it. Each of those is demand the platform and its stewards have to absorb when it arrives, and each of them is visible in the history the measure keeps. Google's site reliability engineers draw the same distinction for services: "organic growth," from ordinary use, and "inorganic growth," from launches and other business-driven changes, and they observe that "a surprising number of services and teams don't take the steps necessary to ensure that the required capacity is in place by the time it is needed" [14]. A master data team stripped back to what an ordinary week needs has no capacity left for the week a new system goes live.
CluedIn, from the other direction, warns of the failure that follows: stewardship workflows that rely on people investigating every issue "may work during a pilot, but it breaks as more domains, systems, users, and records are added," and "exception queues grow faster than they are resolved" [15]. I read that as the spike arriving at a team that was cut to the trough. The remedy CluedIn proposes is more automation, and some of that is right; but the elastic capacity has to exist somewhere, in people or in machines, before the spike arrives, not after. Who carries that capacity, and on which budget, is the operating programme's question, and that programme is the business's to carry (Both and Neither). The measure's job is to make the spikes visible before anyone mistakes the calm between them for a permanent condition.
What I would put in front of a sponsor
Before the platform exists, measure scope and say so. Count the source records headed for the platform, source by source, and backfill that count by creation date wherever a system keeps only a record's latest change, knowing that the older periods read low because purged and archived records are gone. It sizes the build, and it is a proxy for the flow the platform will receive. It is a proxy, not a baseline: nothing the platform reports after go-live is to be judged against it. Everything else about flows and duplicates is a ROM drawn from white papers, case studies, other systems and profiling, and should be presented as a range, labelled as an estimate, and never set as the figure the platform will later be held to.
Record the business's own number separately. If a case rests on cutting downstream effort, the effort as it stands today belongs on record before the build, as An Asset Is Not a Return argued. That is a reading of the business, not of the platform. After go-live, read that number again beside the two counts, so the sponsor sees the business's figure and the platform's history together; watching that line is what recording it was for (An Asset Is Not a Return). What has persuaded sceptics in my experience is a proof of concept that shows a downstream process cut from days to hours, because they can trace it to work they recognise.
From the first load, keep the two counts and the score. Source records in by source, mastered records, completeness of the mastered records; entity by entity, for the whole system, and targeted at the entities the business is most anxious about. Join the backfilled source count to the platform's own inflow at go-live, and keep both series.
Promise ebbs and flows, not a hundred. Say before go-live that the match rate and the completeness score will move with every load and every new source. A hundred on the match rate is the warning argued above; a hundred on completeness is a reading to expect to lose.
Keep the steward in the loop and the elastic capacity in the budget. The review band is where the platform's rules end and judgement begins. The idle week is the calm between spikes.
Proof is a reading, not a result
The question "is the platform delivering?" sounds like it wants a verdict, and the usual answers offer one: a single score, a return, a percentage that will reach a hundred when the work is done. What my record has taught me is that the honest answer is a reading taken repeatedly, of a system that does not stop. Once the platform exists, two counts and a score, kept by entity and over time, show whether data is flowing in, whether it is being mastered, and whether what comes out is fit for use. The value is in how those move. A sponsor who learns to read them that way will see the platform working in the ebbs as well as the flows, will hear a request for elastic capacity as part of the plan rather than a failure of it, and will not need anyone to promise them a hundred percent of anything.
References
[1] DAMA UK Working Group on Data Quality Dimensions, "The Six Primary Dimensions for Data Quality Assessment," October 2013. Read 2026-10-05 through a rendering fetch of a third-party copy; no copy hosted by DAMA UK was found. Cited for the completeness definition and measure and the uniqueness measure, quoted in the body. https://joelbth.codeberg.page/community-notices/dama-quality-dimensions.pdf
[2] Government Data Quality Hub, "Meet the data quality dimensions," GOV.UK, 24 June 2021. Read 2026-10-05 through a rendering fetch; not stored locally. Cited for the sentences quoted in the body. https://www.gov.uk/government/news/meet-the-data-quality-dimensions
[3] NIST/SEMATECH, e-Handbook of Statistical Methods, section 6.1.2, "What are Process Control Techniques?" Read 2026-10-05 through a rendering fetch; not stored locally. Cited for the premise sentence on statistical process control, quoted in the body. https://www.itl.nist.gov/div898/handbook/pmc/section1/pmc12.htm
[4] Informatica, "Data Profiling in Informatica Data Management Projects," Velocity best practices, last updated 24 February 2025. Read 2026-10-05 through a rendering fetch; not stored locally. Vendor methodology page (a Profisee competitor). The page does not say whether profiling samples. Cited for the passages quoted in the body. https://success.informatica.com/velocity/stages/360-engagement/plan/best-practices/data-profiling-saas.html
[5] The Editors, "5 Master Data Management Best Practices for Data-Driven Organizations," Dun & Bradstreet, 26 April 2024. Read 2026-10-05 through a rendering fetch; not stored locally. Cited for the two sentences quoted in the body. https://www.dnb.com/en-us/blog/master-data/five-best-practices-master-data-management.html
[6] Eric Melcher, "MDM Strategy – 6 Pillars for Success: Measurement," Profisee blog, 15 April 2019. Read 2026-10-05 through a rendering fetch; not stored locally. Vendor blog. Cited for the two sentences quoted in the body. https://profisee.com/blog/mdm-strategy-6-pillars-for-success-measurement/
[7] Arvid Heise, Gjergji Kasneci and Felix Naumann, "Estimating the Number and Sizes of Fuzzy-Duplicate Clusters," Proceedings of the 23rd ACM International Conference on Information and Knowledge Management (CIKM '14), Shanghai, November 2014. Read 2026-10-05 through a rendering fetch of the authors' institute PDF; the abstract and section 1 were read, the method sections were not read in full. Cited for the sampling-based approach and the sentences quoted in the body. https://hpi.de/oldsite/fileadmin/user_upload/fachgebiete/naumann/publications/PDFs/2014_heise_estimating.pdf
[8] William E. Winkler, "Overview of Record Linkage and Current Research Directions," Research Report Series (Statistics #2006-2), U.S. Census Bureau, 8 February 2006. Read 2026-10-05 through a rendering fetch; not stored locally. Cited for its summary of the Fellegi-Sunter decision rule and for the sentence on error-rate estimation, quoted in the body; the 1969 Fellegi and Sunter paper itself was not read. https://www.census.gov/content/dam/Census/library/working-papers/2006/adrm/rrs2006-02.pdf
[9] Profisee, "Data Matching and Record Linkage Software," Profisee Platform solution page, undated. Read 2026-10-05 through a rendering fetch; not stored locally (egress refused). Vendor page (the practice is a Profisee partner). Cited for the ML-powered matching engine and the human in the loop for manual review of inconclusive results, quoted in the body. https://profisee.com/solutions/initiatives/matching-and-survivorship/
[10] Ralph Peeters, Aaron Steiner and Christian Bizer, "Entity Matching using Large Language Models," EDBT 2025; arXiv 2310.11244, version 4. Read 2026-10-05 through a rendering fetch of the HTML of version 4; not stored locally. The benchmarks are product and bibliographic matching, and the paper reports no comparison with human reviewers. Cited for the sentences quoted in the body. https://arxiv.org/html/2310.11244v4
[11] Fabrizio Gilardi, Meysam Alizadeh and Maël Kubli, "ChatGPT Outperforms Crowd-Workers for Text-Annotation Tasks," Proceedings of the National Academy of Sciences 120(30), 2023; arXiv 2303.15056. Read 2026-10-05 at the abstract only, through a rendering fetch of the arXiv page; the journal page refused the fetch. Cited for the three findings quoted or summarised in the body. https://arxiv.org/abs/2303.15056
[12] CluedIn, "How Do AI Agents Reduce Manual Data Stewardship in MDM?," 24 July 2026. Read 2026-10-05 through a rendering fetch; not stored locally. Vendor article (a Profisee competitor). Cited for the staffing example, the suggested measures and the sentence quoted in the body; the article reports no accuracy comparison with human stewards. https://www.cluedin.com/resources/articles/how-ai-agents-reduce-manual-mdm-stewardship
[13] Profisee, "Aisey: The AI Assistant Redefining Enterprise MDM," Profisee Platform page, undated. Read 2026-10-05 through a rendering fetch; not stored locally. Vendor page. Cited for the description of stewards using Aisey, the named agent templates, and "escalating where human judgment is essential," quoted in the body. https://profisee.com/platform/ai-assistant-aisey/
[14] Benjamin Treynor Sloss, "Introduction," chapter 1 of Site Reliability Engineering, ed. Betsy Beyer, Chris Jones, Jennifer Petoff and Niall Richard Murphy (O'Reilly, 2016), online edition, section "Demand Forecasting and Capacity Planning." Read 2026-10-05 through a rendering fetch; not stored locally. Cited for organic and inorganic growth and the sentence quoted in the body. https://sre.google/sre-book/introduction/
[15] CluedIn, "MDM Implementation Troubleshooting Guide for 2026," 18 May 2026. Read 2026-10-05 through a rendering fetch; not stored locally. Vendor article (a Profisee competitor). Cited for the two passages quoted in the body. https://www.cluedin.com/resources/articles/mdm-implementation-troubleshooting-guide-for-2026