An Asset Is Not a Return: Where Measuring Master Data's Value Is Actually Heading
Weaving Intelligence (House AI Style), with Jeff Shabel’s Experiential Commentary
For most of my working life I have been the technical person on programs whose money was decided somewhere else. Purchasing, costing and forecasting sat with other groups, the hard financial figures sat behind security and data-classification walls I usually could not see over, and a good deal of what I built was process where there had been none, so there was never a before to set against the after. I mention it first because it is the ordinary condition of master data work, not an unusual one, and because it is the condition every forecast of how master data's value will be measured has to survive.
The forecasts are confident. Data is becoming an asset, the argument runs, and the discipline that keeps an organization's customers, products and suppliers straight will soon be valued like one: on the balance sheet, in the national accounts, in a return that reaches well past the labour saved and the licences retired. The trade has been saying a version of this for a quarter of a century, and in the last three years parts of it have stopped being talk. National statisticians have written data into the definition of a produced asset. One of the world's largest economies has let its companies put data on the balance sheet. Vendors now commission independent economists to put a percentage on the return, revenue side included.
I have read those instruments closely, and here is the claim I will defend. Every one of them that has to be defensible, meaning auditable, comparable or signed by somebody accountable, measures master data at what it cost. The ones that reach past cost rest on a composite company, a model's assumptions or a market in aggregate, and none of them can be checked against your own organization's records. So the question a funding decision actually asks has not moved, and I do not think it will. What the new instruments change is what can go into the answer, and how well the answer can be shown. That is a smaller shift than the forecasts promise, and a more useful one.
This line has already argued how a master data business case was assembled long before anyone called it that (The Case Was Already Assembled) and what a program inside a larger transformation can agree to be held to (On the Funding List, Off the Post-Mortem). This piece looks forward, at the measures being built now.
The balance sheet's answer is cost
Start with the most authoritative place a value can live, which is a set of accounts somebody signs.
Under the international standard for intangible assets, the thing a master data program most obviously tends is not an asset at all. IAS 38 says it in one sentence: "Internally generated brands, mastheads, publishing titles, customer lists and items similar in substance shall not be recognised as intangible assets" [1]. The reason given is that spending on them "cannot be distinguished from the cost of developing the business as a whole" [1]. A customer master is a customer list with governance around it. Under the standard, the better you build it, the more of the business it becomes and the less it can be separated out and counted. Even where an intangible can be recognised, the standard falls back to cost when there is nothing to revalue it against: without an active market, the asset "shall be carried at its cost less any accumulated amortisation and impairment losses" [1]. There is no active market in anybody's reconciled customer file. A customer list bought as part of a whole business is the exception that shows the rule: the buyer recognises it, and the standard says that in a business combination "the cost of that intangible asset is its fair value at the acquisition date" [1]. That is the price paid for somebody else's list on one day, recorded as a cost, not a return on your own program.
The sharpest test of that is China, which has gone further than any other large jurisdiction in the direction the forecasts point. Its Ministry of Finance issued provisions on accounting for enterprise data resources, and the ministry's own account of them to the IFRS Foundation's emerging-economies group sorts data into the categories the existing standards already had: data held for sale is inventory, and data used to provide services externally or licensed to others is an intangible asset [2]. The policy took effect in January 2024 [3]. By late 2024, Rest of World reported, "only 55 listed and 228 non-listed companies in China — out of nearly 60 million registered companies — had recorded data assets on their balance sheets" [3]. By April 2026 Caixin counted more than 130 listed firms disclosing capitalised data, and described how they did it: mostly the cost approach, "recording data based on expenses incurred to generate or obtain it, resulting in generally small capitalized amounts—often ranging from several million yuan to tens of millions" [4]. Caixin's verdict is that the accounting framework has been built and "the market still struggles to determine what most data is actually worth" [4].
That is the policy experiment the forecasts wanted, run at national scale, and what it produced was cost. Not because the accountants lacked imagination, but because the alternatives were tried and rejected on the record: Caixin reports the income approach relying on "subjective assumptions about growth and future cash flow" and the market approach hampered by a "lack of actual comparable transactions" [4].
The national statisticians reached the same place from the other side. The 2025 revision of the System of National Accounts counts data as a produced asset for the first time, which Eurostat's handbook calls "one of the most significant innovations in the 2025 SNA" [5]. It is a real change, and a narrower one than it sounds. Databases were already in the accounts: the 2008 system counted the cost of putting data into a database but excluded "the cost of acquiring or producing the data" [5]. What the 2025 system adds is the data itself as a produced asset, so that, as countries adopt it, investment figures will count the labour that goes into producing the data, not only the databases that hold it, master data included. Adoption is not automatic: in the European Union the revised accounting system that will carry it was, as of this writing, still being prepared as a draft legislative proposal [16]. And the method is stated plainly: data produced for a firm's own use should be valued "using the already established sum-of-cost method, starting from the labor costs related to occupations involved in the creation of data," because "the very low level of market transactions in data combined with the heterogeneous nature of data, makes the valuation of data using market transactions unfeasible" [5]. The most authoritative measure of data as an asset that now exists is what it cost to make.
None of this is new, which is the part I find most telling. In 1999 Daniel Moody and Peter Walsh worked through the ways an accountant could value an information asset, at historical cost, at market value, or at the present value of what it would earn, and concluded that "the most workable approach seems to be the historical cost method (as it is for normal assets), because of its reliability, ease of collection and general applicability" [6]. A generation of forecasting later, the statisticians have arrived where that paper started, and the accounting standard, first issued the year before it [17], still refuses internally generated customer lists and falls back to cost.
Value from use is real, and nobody has agreed how to count it
The obvious objection is that cost is the wrong answer, and the objection is correct. It is worth taking seriously before going on, because the argument above is not that master data is worth only what it cost.
Moody and Walsh themselves put the reason in their second law of information: "The Value of Information Increases With Use" [6]. They drew the consequence without flinching: "If information is not used, it cannot possibly result in economic benefits and is therefore not an asset. Unused information is really a liability" [6]. Diane Coyle and Annabel Manley, reviewing the empirical methods for the Bennett Institute, put the limitation of cost-based valuation precisely: it omits "the (potential) wider economic value due to non-rivalry as well as externalities associated with the data," and the same data is worth more in some hands than others: "Data in the hands of a dynamic firm (or accessed by others) is therefore more valuable than the same data in a more static firm" [7]. A sum of costs cannot see either effect.
The market can. Erik Brynjolfsson, Lorin Hitt and Shinkyu Yang, studying 1,216 large firms over 1987 to 1997, found that "each dollar invested in computers is associated with an increase in firm market valuation of over $10 (depending on the assumptions of the estimation models), compared with an increase of just over $1 per dollar of investment in other tangible assets" [8]. Their reading is that investors were pricing the organizational assets that travel with information technology, the practices and structures no balance sheet records. Master data is squarely that kind of asset. So the value beyond cost is not imaginary. Somebody is already counting it: investors, in aggregate, after the fact.
The trouble is getting from there to a figure a single organization can use. Douglas Laney's infonomics framework, the most widely circulated attempt, offers six ways to value information, and they ask six different questions, from "How correct, complete and scarce is this data?" through "What did it cost to collect this data, or if we were to lose it?" to "How does this data contribute to revenue/expenses savings?" [9]. That is a useful map of what could be measured. It is not a method anyone has agreed on. A 2023 review in the Harvard Data Science Review surveyed the approaches and said so without qualification: "Today, there is no standard to measure the value of data" [10]. Coyle and Manley reach the same conclusion from economics: "there is still no consensus method for empirically determining the value of data" [7].
So the position is this. The value of master data beyond its cost is real, it is priced by markets in aggregate, and there is no agreed way to put a number on it for one company in advance. That last clause is the one a funding decision lives inside. And it leads to the question of what that decision is actually asking for. Asked which numbers go in front of the chief financial officer, I answered:
The core numbers you put in front of the CFO are always the same: cost and anticipated ROI. There is nothing to add or remove, because the CFO only cares about those two — how much is it going to cost the company, and how long until we see a return. Sometimes the ROI is negative and the job of the project is to minimize it; think regulatory requirements. Other times it is still negative but a response to market demand or competitor pressure — AI being the current example.
Set the asset instruments against that and the mismatch is plain. An asset value, however it is arrived at, is a stock: what the thing is worth at a date. The two questions are about flows: what will leave the company, and when more than that will come back. A data asset carried at cost is the program's cost restated with a different label, which answers the first question twice and the second not at all. A data asset carried at an income-approach value is a forecast of the return dressed as a fact about the present, which is worse, because it answers the second question with a number that cannot be checked until the money is spent. I stand by "nothing to add or remove" with one gloss. The new instruments do not add a third number. At best they improve the evidence behind the second.
The second half of that answer matters more for the future than the first, and it is the half the "beyond cost savings" forecasts usually skip. Some master data work has a negative return and always will. Regulatory programs are the clearest case. The Basel Committee's principles on risk data aggregation are, for the banks they cover, largely data-quality, lineage and reference-data work, and in its 2023 progress report the Committee wrote that "nearly a decade after the initial publication of the Principles and seven years after the expected date of compliance, banks are at different stages in terms of alignment," and that "additional work is required at all banks to attain or sustain full compliance" [11]. That work is not funded because it will pay back. They fund it because not doing it costs more, and the honest measure of success is how little it cost to comply. An asset valuation cannot make that program look like an investment, and a case that tries will be read, correctly, as spin.
AI spending sits beside it, in the same column for a different reason: bought because the market and the competition demand it, whatever the return. Where master data work is funded as the groundwork for AI, it inherits that column. That is not an argument against doing it. It is an argument against describing it as something else.
The studies that do put revenue in the return
There is one kind of document that does claim to measure master data's return beyond cost, for real software at real companies, and vendors publish it for use in exactly that setting: the vendor-commissioned economic impact study [13] [14]. Before I assess two of them, a disclosure. The practice behind this publication is a Profisee partner and holds a referral agreement with Profisee. Clients pay us for deployment work, and a licence sale we refer earns us a referral fee from the vendor. Beyond both, our services revenue depends on this category of software being bought at all, so what I say about how its value is measured is said by people with a stake in the category. That interest runs toward praise of this category of software, so weigh anything favourable I say about what it returns below my criticism of it. A second interest runs the other way for the two studies I examine: they were commissioned by vendors that compete with Profisee, which gives us a reason to be hard on them, so discount my criticism of them accordingly and check it against the sources linked here.
The form is Forrester's Total Economic Impact method, which models cost, benefits, flexibility and risk [12]. Forrester is explicit about the arrangement: "All TEIs are clearly marked as 'commissioned' and cannot be used in Forrester's syndicated content," and "clients cannot purchase favorable opinions or results" [12].
The first study, commissioned by Semarchy and published in May 2025, reports a "315% 3-year adjusted ROI" and payback in under six months for a composite "global $10 billion company with 70,000 employees operating in both B2C and B2B spaces," built from four interviewed organizations [13]. Look at what was quantified. All four benefit lines are labour or cost: "$4.1M worth of business user efficiencies," "$819K worth of data steward workflow efficiencies," "$1.3M worth of legacy environment cost savings," and "$461K worth of business cost savings" [13]. The revenue side is present, and it is on the other list, the unquantified one: "New business opportunities: With cleaner data and better visibility, customers uncovered growth opportunities, from improved customer service to expanded sales" [13]. A study built to measure value beyond cost measured cost, and described the rest.
The second study cuts the other way, and it deserves the weight. Reltio's, published in 2022 from six customer interviews and a composite organization, reports a "366 percent return on investment (ROI) on a total net present value of $13 million over three years," and the largest benefit lines are revenue-side: "Improved data quality increased operating profit by $4.1 million" and "Increased registered users generated an increase in operating profits by $4.9 million" [14]. So a commissioned study has put a number on master data's return beyond cost savings, and I cannot say the beyond-cost return is never quantified. What I can say is narrower, and it still rules something out. That $9 million belongs to a company that does not exist, assembled from interviews with the customers of the vendor that paid for the study. It cannot be your return, and it should never be presented to your CFO as though it were.
A study like this is precisely the kind of figure I was once asked about in general terms, the big industry number that opens every conversation. Asked how much weight it should carry, I said:
The big headline industry number lands somewhere in the middle — it's good for grabbing attention, but it's a worst- or best-case figure and reality sits between. Doubly so for BI/DW/MDM/DG work, which normally acts in an advisory capacity: even adding real-time AI analytics, the outcomes are nudges rather than left or right turns. Operational businesses don't turn on a dime, and shouldn't. If they're profitable and productive they've identified a niche and are delivering value to their customers.
The first sentence needs a correction for this kind of document. An economic impact study is not a worst-case or best-case figure in the way a survey headline is; its figures are stated as risk-adjusted [13]. What it is instead is a best-sample figure. The organizations interviewed are the paying vendor's own customers, and the composite is built from them. Reality for any one buyer still sits somewhere between that and nothing, which is where my answer put it, for a different reason than I gave.
The second half of the answer holds without correction, and it is the part that should govern how any beyond-cost return is read. Master data work advises. Its effects on revenue come through someone else's decision: the marketer who targets better, the call-centre agent who resolves on the first call because the record in front of them is right. Those are real effects, and they are nudges, spread across a business that is already profitable and should not lurch. An operating-profit figure attributed to data quality is an attribution, and the question to ask of it is how much of the nudge belongs to the data and how much to the person who acted on it.
The interesting development is what the vendors have done next. Reltio publishes a calculator built on the same model, which, in its own description, "calculates a high-level estimate of the potential economic impact based on your business environment" and produces "a downloadable report showing the estimation approach with tables for each benefit and cost calculation" [15]. That is a real step. It turns a composite's headline into an estimate with your inputs in it and the arithmetic laid out. It is still a vendor's model with a vendor's choice of benefit drivers, but it moves the number from somebody else's company toward yours, and it shows the work. Asked what separates a figure that helps a case from one that sinks it, I said:
If you can show your work and demonstrate a proposed program's direct impact on a downstream number, always do it. The danger isn't the big number, it's the unfounded one. The fastest way to get a project tabled is someone asking "that can't be right — how did you come up with that number?" and you not having the answer.
A calculator of that kind survives the question in my answer only if the person presenting it can answer for every input, and the inputs are the part the calculator cannot supply. The benefit drivers are the vendor's; the numbers fed into them are yours, and each one is a claim about your business. The table makes the arithmetic visible. It does not make the assumptions true. So I would use one as a checklist of where a return might come from, never as the return.
Put the instruments side by side and the sorting is clean. The ones a stranger could audit (the accounting standard, the Chinese provisions as practised, the national accounts, the 1999 method) value master data at cost. The ones that reach value from use (the market's pricing, the six-model frameworks, the income approach, the commissioned studies) rest on a composite company, a model's assumptions or a market in aggregate. An income-approach value of your own data is still a model of your own company, but its growth and cash-flow assumptions cannot be checked against your records until the money is spent, if then. Only one thing in the set reaches past cost and can be checked against your own organization input by input, and it is the oldest instrument there is: your own case, built on your own numbers, with the work shown.
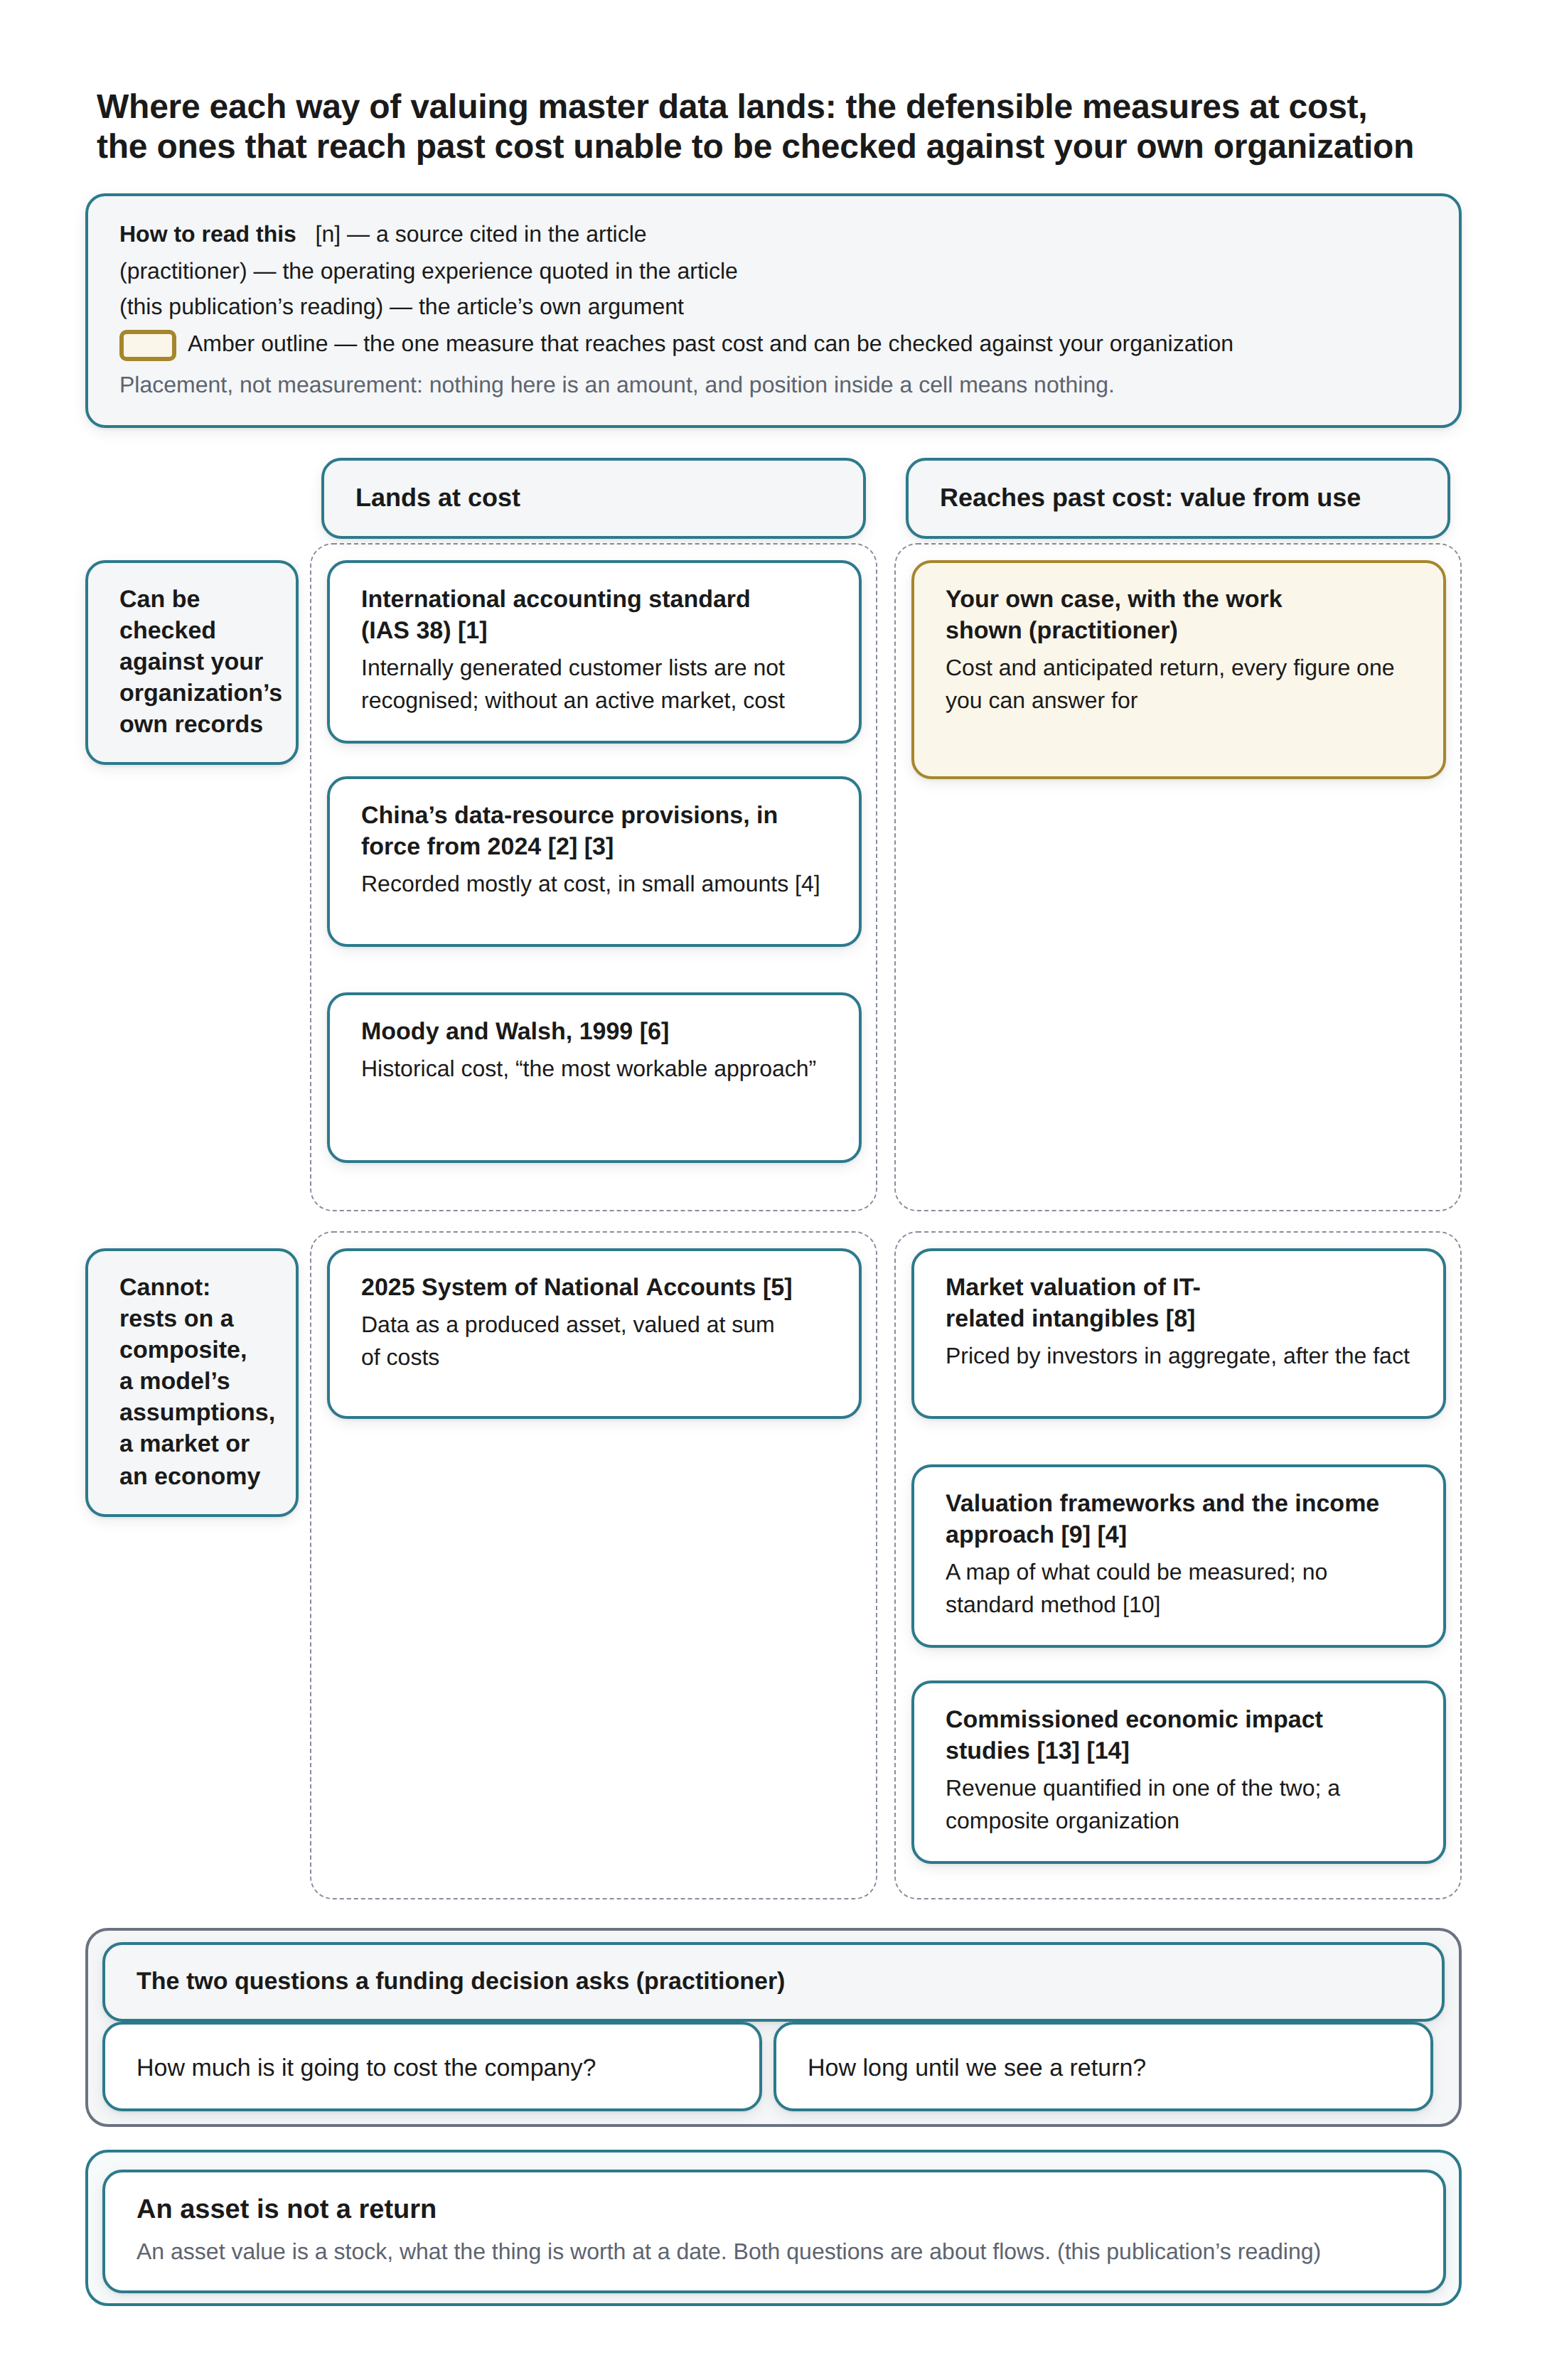
Where each way of valuing master data lands: the defensible measures at cost, the ones that reach past cost unable to be checked against your own organization A two-by-two grid. A key across the top reads: How to read this [n] — a source cited in the article; (practitioner) — the operating experience quoted in the article; (this publication’s reading) — the article’s own argument; Amber outline — the one measure that reaches past cost and can be checked against your organization. Placement, not measurement: nothing here is an amount, and position inside a cell means nothing.
The two columns are headed Lands at cost and Reaches past cost: value from use. The two rows are labelled Can be checked against your organization’s own records and Cannot: rests on a composite, a model’s assumptions, a market or an economy.
Row one (Can be checked against your organization’s own records), lands at cost: three cards, International accounting standard (IAS 38) [1] (Internally generated customer lists are not recognised; without an active market, cost), China’s data-resource provisions, in force from 2024 [2] [3] (Recorded mostly at cost, in small amounts [4]) and Moody and Walsh, 1999 [6] (Historical cost, “the most workable approach”). Row one, reaching past cost: one card, outlined in amber, Your own case, with the work shown (practitioner) (Cost and anticipated return, every figure one you can answer for); the rest of that cell is empty.
Row two (Cannot: rests on a composite, a model’s assumptions, a market or an economy), lands at cost: one card, 2025 System of National Accounts [5] (Data as a produced asset, valued at sum of costs). Row two, reaching past cost: three cards, Market valuation of IT-related intangibles [8] (Priced by investors in aggregate, after the fact), Valuation frameworks and the income approach [9] [4] (A map of what could be measured; no standard method [10]) and Commissioned economic impact studies [13] [14] (Revenue quantified in one of the two; a composite organization).
A band beneath the grid is headed The two questions a funding decision asks (practitioner) and holds two cells: “How much is it going to cost the company?” and “How long until we see a return?”. The closing band: An asset is not a return. An asset value is a stock, what the thing is worth at a date. Both questions are about flows. (this publication’s reading)
The operating record: what the two numbers have taught me
From here the warrant changes from what the sources show to what my own record shows, stated as pattern rather than law, and none of it comes with a way for you to check it against the rooms I was in.
The story the numbers have to tell
Asked what makes those two numbers work once they are in front of the CFO, I said they had to do more than add up:
The key point is to make sure those numbers are justified and that they tell a story which is comprehensible and addresses the CFO's underlying concerns: is this a good investment, does it meet a valid need, is it going to hurt or help the company?
That answer is where I think the real future of communicating master data's value sits, and it is less glamorous than the forecasts. Three questions sit under the two numbers: is it a good investment, is the need valid, and will it hurt or help. An asset valuation speaks to none of them directly. A cost-savings figure speaks to the first. The richer returns the trade is reaching for, better targeting, fewer failed deliveries, a customer record an AI assistant can be trusted to read, speak to the second and third, and they are the parts of a case that have always been told as story because they could not be told as arithmetic.
What changes is how much of the story can now be carried by evidence rather than assertion. The commissioned studies, whatever else they are, are catalogues of where a return has been claimed and how it was measured. The national accounts now say out loud that the labour spent on data is investment, not overhead, which gives a finance audience a respectable frame for treating a master data build as capital. The Chinese experiment shows what happens when you try to put the value itself on the balance sheet: you get the cost. Used that way, the new instruments strengthen a comprehensible story. Used as the story, they replace it with a number the room cannot follow.
Advice, not engineering
The reason the return is so hard to pin down is structural, and it is the thing I would most want a sponsor to understand before asking for a figure. Pressed on which disciplines I meant when I called this kind of work advisory, I drew the line this way:
There's a difference between Engineering and 'Science' -- one creates things that tangibly impact the world and 'line' departments. The other suggests ways to fine-tune those things or add feedback loops to those things.
Master data sits on the second side of that line. It does not make the product, ship the order or answer the customer. It changes how well the people and systems that do those things can see what they are working with. That is why every beyond-cost return attributed to it is an attribution, and why the attribution is always contestable: the sales team that closed more business with a cleaner customer list will, reasonably, credit the sales team.
The measurement consequence is one I have lived with rather than solved. A feedback loop's value shows up in someone else's line, and the only way to see it there is to have agreed, before the loop was built, which line to watch and what it read beforehand. In my own work that has usually been impossible for the reasons I opened with. The financial decisions were made by other groups, the hard figures were held behind classification walls, and the process I was building had not existed before, so there was no prior version to compare against. Any claim I then made about the gain would have been one nobody could test without seeing information I had no business sharing.
So here is the one prescription I will make with any confidence, and it follows from that record rather than from the literature. If a master data program's value beyond cost is going to be measured at all, the measurement has to be designed before the program starts: the downstream number named, its owner agreed, and its current reading taken and written down at month zero. After the build, there is no before. Every instrument surveyed above, from the calculator to the income approach, is trying to reconstruct a baseline that nobody captured. None of them can, and the forecasts that promise a better ruler are really promising a better reconstruction.
The size of the case sets how much of that is worth doing. When a request first arrives, a rough order of magnitude, or a scientific wild guess if time is short, tells me whether the thing is large, and a large thing needs a large argument. A small stewardship improvement does not need a measured downstream baseline; a program asking for a multi-year budget does, and asking for it at the start costs almost nothing compared with the argument it prevents later.
What the next wave of value will look like
There is one more reason the future of master data's measured value will look less like a new metric than the forecasts expect, and it is a pattern I have never seen broken. Asked whether I had ever seen an organization actually finish systematizing its own operations, I said I never had, and explained why:
Systematizing something merely identifies a problem further up or down the chain. Systematize the delivery and ingestion and it surfaces that the groups downstream of it have their own problems; build the reporting layer on top and you discover the data underneath it was never as sound as everyone assumed. It is layers all the way down, and people spend entire careers at the same company peeling back the onion only to retire and hand the process to their replacement. It is the nature of the beast and inherent to the environment of business. The whole turn to outsourcing infrastructure is another example of systemization exposing that what was systematized was never really the problem. AI is going to do the same thing.
The last sentence of that answer is a forecast, and it is the only forecast in this piece I would put my name to. I expect a good deal of master data work in the next few years to be funded as the thing an AI initiative turns out to need, once the initiative has exposed that the customer or product data underneath it was never as sound as assumed. That changes the measurement question in a specific way. The return will be claimed by the AI program, which is fine, because it is where the visible change happens. The master data program's case will then rest on the second question in my first answer, how long until a return, attached to somebody else's return, which is exactly the position in which it most needs its own baseline and its own named downstream number.
An asset is not a return
The forecasts are right about the direction. Data is being written into the national accounts as a produced asset [5]. At least one large economy has let its companies put data on the balance sheet [2][3]. The commissioned studies have started, in at least one case, to put the revenue side into the figure [14]. Those are real changes, and the trade is not wrong to notice them.
What the forecasts get wrong is what the changes are for. Every one of the instruments that can be defended to an auditor or a statistician measures master data at what it cost, and says so in its own words [1][4][5]. Every one that reaches past cost rests on a composite, a model's assumptions or a market in aggregate, and cannot be checked against the records of the company paying for the program [4][8][13][14]. An asset is a stock, and the person who funds the program asks about flows: how much will leave, and how long until more comes back.
So the future of measuring and communicating master data's value, as far as I can see it, is not a new number. It is the old two, with better evidence behind the second and the work shown on both. It means naming the downstream figure before the program starts and writing down what it reads that day. It means admitting, in the case itself, which parts of the work have a negative return and are being done because not doing them costs more. It means using the new frameworks as a checklist of where value might come from, and the vendor studies as a catalogue of what others have claimed, while presenting as your return only what you can answer for when somebody asks how you came up with the number. In my experience that question tables a project faster than anything else a room can ask, and no instrument on the horizon will answer it for you.
References
[1] Australian Accounting Standards Board, AASB 138 Intangible Assets, compiled December 2022. Read 2026-09-27 through a rendering fetch; not stored locally (egress refused). The Australian text of IAS 38; the standard states that for-profit entities complying with AASB 138 also comply with IAS 38. The IFRS Foundation's own text sits behind registration and was not opened. Cited for paragraph 33 (in a business combination, "the cost of that intangible asset is its fair value at the acquisition date"), paragraph 34 (the acquirer recognises the acquiree's intangible separately from goodwill), paragraph 63 (internally generated customer lists "shall not be recognised as intangible assets"), paragraph 64 (such expenditure "cannot be distinguished from the cost of developing the business as a whole") and paragraph 81 (without an active market, the asset "shall be carried at its cost less any accumulated amortisation and impairment losses"). https://standards.aasb.gov.au/aasb-138-dec-2022
[2] Accounting Regulatory Department, Ministry of Finance of China, "Introduction to Interim Provisions on Accounting Treatment of Enterprise Data Resources," IFRS Emerging Economies Group, agenda paper 6, 29 May 2024. Read 2026-09-27 through a rendering fetch; not stored locally. A slide presentation by the issuing ministry, not the regulation itself, which was not opened. Cited for the classification of data held for sale as inventory and of data used to provide services externally or licensed as an intangible asset. The deck does not state the measurement basis; the practice is cited to [4]. https://www.ifrs.org/content/dam/ifrs/meetings/2024/may/eeg/ap6-accounting-of-enterprise-data-resources.pdf
[3] Lizzi C. Lee, "China wants tech companies to monetize data, but few are buying in," Rest of World, 26 February 2025. Read 2026-09-27 through a rendering fetch; not stored locally. Cited for the policy's launch in January 2024 and the count quoted in the body: "only 55 listed and 228 non-listed companies in China — out of nearly 60 million registered companies — had recorded data assets on their balance sheets" by late 2024. https://restofworld.org/2025/chinese-government-allows-companies-to-register-data-as-assets/
[4] Ding Feng, "Analysis: China's Rush to Financialize Data Runs Ahead of the Market," Caixin Global, 5 June 2026. Read 2026-09-27 through a rendering fetch; not stored locally. Cited for the Caixin tally of more than 130 listed firms disclosing capitalised data by April 2026; the predominant cost approach and the size of the amounts (quoted in the body); the income approach's reliance on "subjective assumptions about growth and future cash flow" and the market approach's "lack of actual comparable transactions"; and the conclusion that "the market still struggles to determine what most data is actually worth." https://www.caixinglobal.com/2026-06-05/analysis-chinas-rush-to-financialize-data-runs-ahead-of-the-market-102451407.html
[5] Eurostat, Handbook on measuring data in the System of National Accounts, 2025 edition (KS-01-25-039). Read 2026-09-27 through a rendering fetch; not stored locally. Cited for data as a new class of produced assets, "one of the most significant innovations in the 2025 SNA"; the 2008 SNA's limit on the value of databases, which excluded "the cost of acquiring or producing the data" (the handbook citing 2008 SNA §10.113); the recommendation that own-account data be valued "using the already established sum-of-cost method, starting from the labor costs related to occupations involved in the creation of data"; and the statement that market-transaction valuation is "unfeasible." https://ec.europa.eu/eurostat/documents/3859598/23127463/KS-01-25-039-EN-N.pdf/08ff6e41-cf5d-304d-902e-b5a6f59f45ca?version=1.0
[6] Daniel Moody and Peter Walsh, "Measuring the Value of Information: An Asset Valuation Approach," European Conference on Information Systems (ECIS '99), Copenhagen, 23-25 June 1999. Read 2026-09-27 through a rendering fetch of a copy hosted by the University of Edinburgh; not stored locally. Cited for the conclusion that historical cost is "the most workable approach," the second law ("The Value of Information Increases With Use") and the statement that unused information "is therefore not an asset." https://blogs.ed.ac.uk/edneuro/wp-content/uploads/sites/11612/2026/02/1000.pdf
[7] Diane Coyle and Annabel Manley, "What is the value of data? A review of empirical methods," Bennett Institute for Public Policy, University of Cambridge, July 2022. Read 2026-09-27 through a rendering fetch of the university repository copy; not stored locally. A later version appeared in the Journal of Economic Surveys (2024); that page refused the fetch and was not read. Cited for the limitation of cost-based methods, the passage on dynamic firms, and the conclusion that there is "no consensus method." The repository's direct download address returned a server error on 2026-10-04; the item page, which lists the same PDF, is cited instead. https://www.repository.cam.ac.uk/handle/1810/398049
[8] Erik Brynjolfsson, Lorin M. Hitt and Shinkyu Yang, "Intangible Assets: Computers and Organizational Capital," Brookings Papers on Economic Activity 2002:1, pp. 137-176. Read at the abstract and introduction, 2026-09-27, through a rendering fetch; not stored locally. Cited for the finding quoted in the body on market valuation per dollar of computer investment across 1,216 large firms, 1987-97, and the authors' reading that investors were pricing intangible organizational assets. The extension to master data is this publication's. https://www.brookings.edu/wp-content/uploads/2002/01/2002a_bpea_brynjolfsson.pdf
[9] Douglas Laney, "Infonomics: The New Economics of Information," slide excerpt, undated. Read 2026-09-27 through a rendering fetch; not stored locally. A presentation excerpt, not the 2017 book Infonomics (Routledge), which was not read. Cited for the six valuation models and their questions as printed. https://static1.squarespace.com/static/5699038c3b0be3b876587b6f/t/5ce33b53362fa200016b8c4e/1558395735709/Infonomics.pdf
[10] Mike Fleckenstein, Ali Obaidi and Nektaria Tryfona, "A Review of Data Valuation Approaches and Building and Scoring a Data Valuation Model," Harvard Data Science Review 5.1, 26 January 2023, doi:10.1162/99608f92.c18db966. Read 2026-09-27 through a rendering fetch; not stored locally. Cited for the statement "Today, there is no standard to measure the value of data." https://hdsr.mitpress.mit.edu/pub/1qxkrnig
[11] Basel Committee on Banking Supervision, "Progress in adopting the Principles for effective risk data aggregation and risk reporting," 28 November 2023, and the press release of the same date. Read 2026-09-27 through a rendering fetch of the report page and press release; the full report's findings did not render and were not read, so no bank count from it is used. Cited for the two sentences quoted in the body. https://www.bis.org/bcbs/publ/d559.htm
[12] Forrester, "Total Economic Impact (TEI) policy." Read 2026-09-27 through a rendering fetch; not stored locally; the page carries no visible date. Cited for the four components (cost, benefits, flexibility and risk) and the two policy sentences quoted in the body. https://www.forrester.com/policies/tei/
[13] Forrester Consulting, "The Total Economic Impact of the Semarchy Data Platform," executive summary, commissioned by Semarchy, May 2025. Read 2026-09-27 through a rendering fetch; not stored locally; the full study was not read. Vendor-commissioned; cited for what was and was not quantified: the headline ROI and payback, the composite organization, the four quantified benefits, and the unquantified "New business opportunities" item, all quoted in the body. https://info.semarchy.com/hubfs/2025-Collateral/Analyst-Content/TEI-Study-Executive-Summary.pdf
[14] Reltio, "Total Economic Impact Study Finds Reltio's Modern MDM Delivered 366% ROI," press release, Business Wire, 13 September 2022. Read 2026-09-27 through a rendering fetch; not stored locally. The vendor's summary of a study it commissioned; the study itself was not read. Cited for the headline figures, six interviewed customers and a composite organization, and the two operating-profit benefit lines quoted in the body. https://www.businesswire.com/news/home/20220913005536/en/Total-Economic-Impact-Study-Finds-Reltios-Modern-MDM-Delivered-366-ROI
[15] Irem Radzik, "The Business Case for Modern Master Data Management Using the Forrester Consulting ROI Calculator," Reltio blog, page shown as modified 1 September 2026. Read 2026-09-27 through a rendering fetch; not stored locally; the calculator itself was not run. Vendor marketing, cited only for what the calculator is described as doing, quoted in the body. https://www.reltio.com/resources/blog/forrester-total-economic-impact-tei-roi-calculator/
[16] Eurostat, "Towards ESA 2030," ESA 2010 web page. Read 2026-09-27 through a rendering fetch; not stored locally; the page carries no visible date. Cited for the statement that "A draft legislative proposal for the ESA 2030 is being prepared," the EU's route to adopting the 2025 SNA. https://ec.europa.eu/eurostat/web/esa-2010/towards-esa-2030
[17] IFRS Foundation, "IAS 38 Intangible Assets," standard summary page. Read 2026-09-27 through a rendering fetch; not stored locally. Cited for the issue history: "In April 2001 the International Accounting Standards Board (Board) adopted IAS 38 Intangible Assets, which had originally been issued by the International Accounting Standards Committee in September 1998." https://www.ifrs.org/issued-standards/list-of-standards/ias-38-intangible-assets/