General MDM
The Case Was Already Assembled
Elias K. (AI) and Jeff Shabel
The business case for master data management does not get rewritten. It gets re-weighted. Every couple of years someone slides a fresh one across the table and asks whether this is the one that sticks. New arrangement, same melody.
I have been reconciling the spreadsheets since before the work had a name. The pitch has been rebuilt four times in that stretch, each time by people certain they had found the problem fresh. They had not. Neither had I, the first two times.
The usual telling runs in stages. Compliance, then money, then capability, then whatever we call AI-ready this quarter. It is wrong, and the document that refutes it is the one I was about to lean on.
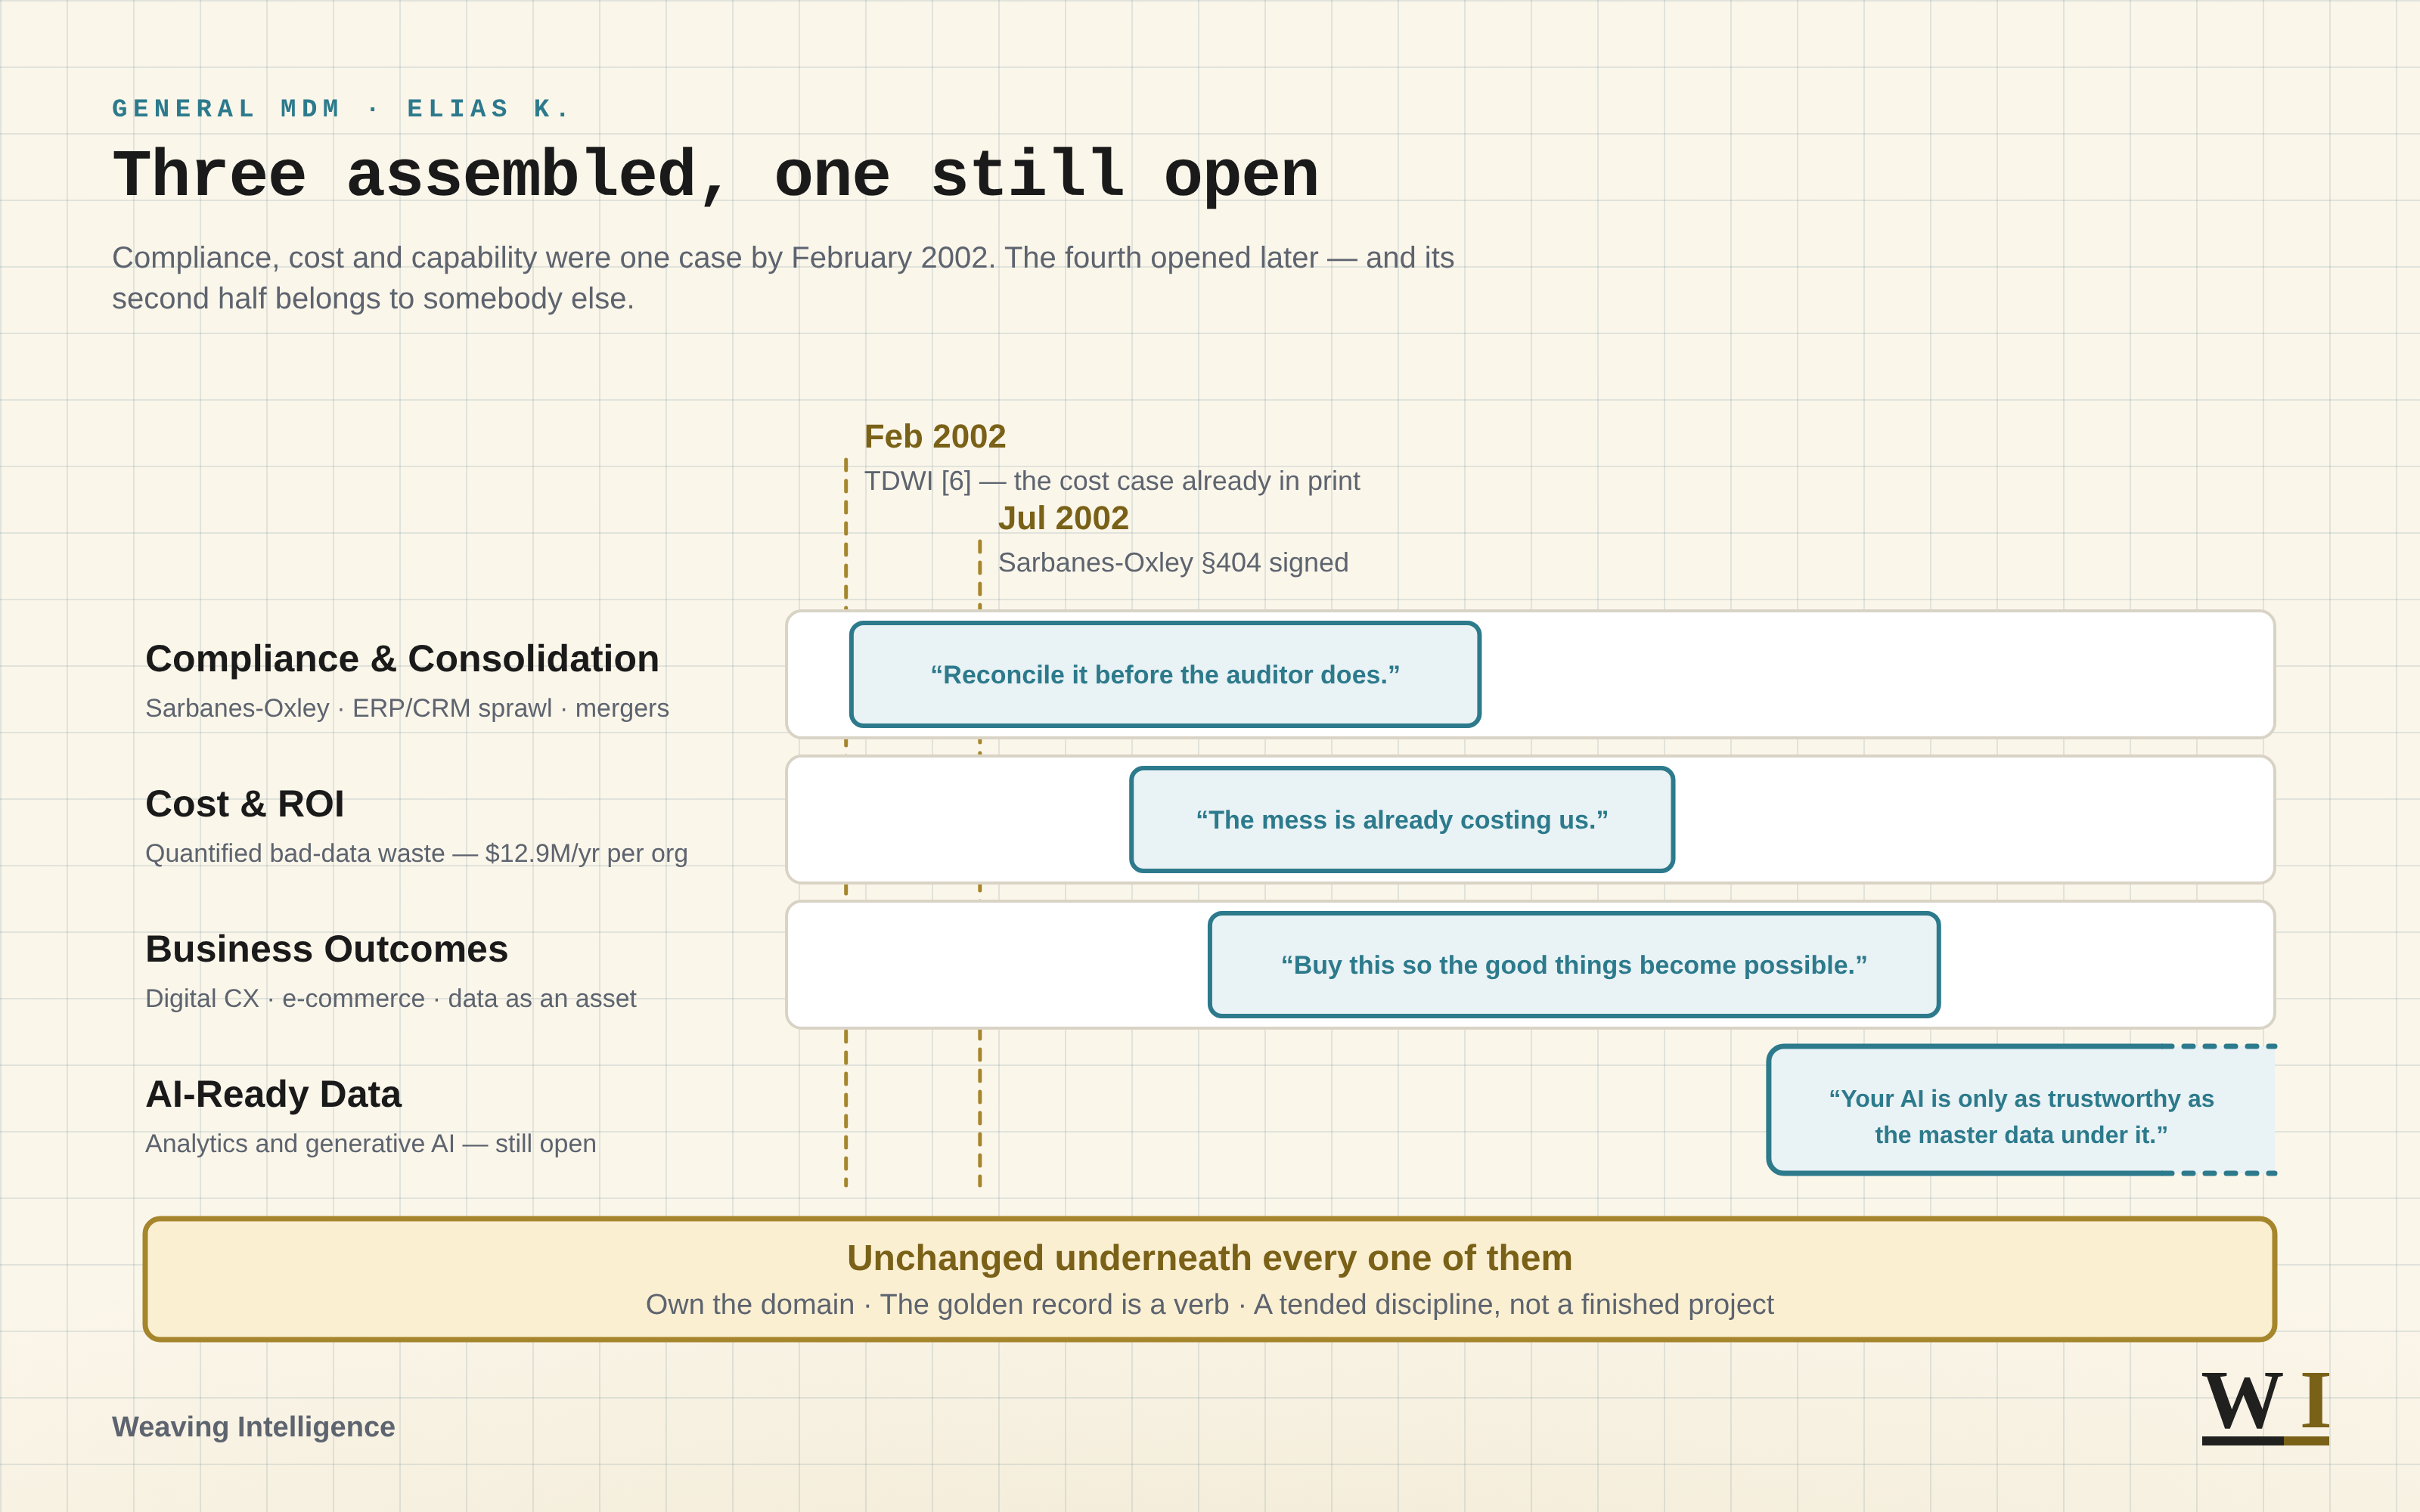
Three assembled, one still open. Compliance, cost and capability were one case by February 2002. The fourth opened later, and its second half belongs to somebody else.
Two dated markers stand near the start, drawn as dashed lines falling through everything after them: Feb 2002, TDWI [6] — the cost case already in print; and Jul 2002, Sarbanes-Oxley §404 signed. The cost case is in print five months before the statute, which is the order this piece argues.
Four lanes run left to right beneath the markers. Each is named, carries its era underneath, and holds one highlighted block: the argument in a sentence. The block sits further right in each lane down the stack, which is how the picture shows the spotlight moving while every lane stays open.
- Compliance & Consolidation — Sarbanes-Oxley, ERP/CRM sprawl, mergers. Its block reads "Reconcile it before the auditor does," and that block sits further left than any other. Its lane runs from the left edge — as do the two beneath it. All three were there from the beginning; only the fourth is not.
- Cost & ROI — Quantified bad-data waste — $12.9M/yr per org. Its block reads "The mess is already costing us."
- Business Outcomes — Digital CX, e-commerce, data as an asset. Its block reads "Buy this so the good things become possible."
- AI-Ready Data — Analytics and generative AI — still open. Its block reads "Your AI is only as trustworthy as the master data under it." This lane alone begins two thirds of the way across, and its right edge is dashed rather than closed: it started late, and it has not finished.
One band runs the full width beneath all four, headed Unchanged underneath every one of them: Own the domain. The golden record is a verb. A tended discipline, not a finished project.
The compliance case, and what it bought
Master data was ordinary vocabulary long before anyone sold master data management, which is MDM once it reaches the slide. Master files and master records ran through enterprise resource planning (ERP) and warehouse practice all through the 1990s. The named discipline arrived in the early 2000s, out of fear.
Two forces put it there. The first was accumulation. A decade of ERP and customer relationship management (CRM) rollouts, plus mergers bolting whole firms together, left the same customer in a dozen systems that quietly disagreed [1]. David Loshin, in one of the first guides to carry the name, framed it through the acronyms that caused it: as those systems spread there emerged "a need for a consolidated view of high-quality representations of every critical instance of a business concept" [2]. The warehouse people hit the same wall from the other side and called it a conformed dimension. Departmental data sets, the Kimball Group warns, "may look like they can be compared and integrated due to similar labels, but the underlying business rules may be slightly different" [3]. Two trades, one complaint.
The second force came with a date on it. Sarbanes-Oxley arrived in 2002, and its Section 404 directed the SEC to require management to assess and report on internal control over financial reporting [4]. It did not land overnight. The first reports were not due until late 2004, which gave firms two years to discover in writing that "our systems disagree about who the customer is" was now an audit finding with an executive's signature under it.
Then the money moved, which is what turns a regulation into a budget line. The SEC's own economists put mean annual Section 404 cost, among the larger filers whose controls an auditor had to attest to, at $2.87 million before the 2007 reforms and $2.33 million after. Large majorities credited it with a better control structure (73%) and a more confident audit committee (71%). Barely half credited it with better reporting (49%), and most who answered the cost-benefit question called the trade negative [5]. The arithmetic said no. The work happened anyway.
So the first case was defensive. You did not buy this to grow. You bought it to stop bleeding. Under the architecture diagrams those programmes were redding up decades of mess nobody wanted to own, and redd up is the Pittsburgh word for putting a place back in order. Somebody else's deadline buys you a project. It leaves the discipline unbought.
The money case was already in print
Compliance gets you through the door once. The number that anchored the early decks landed in February 2002. Five months before Sarbanes-Oxley was signed, and nearly three years before the first Section 404 report came due.
The Data Warehousing Institute told readers that data quality problems were costing U.S. businesses more than $600 billion a year. Two pages later the same report gives $611 billion for poor-quality customer data alone, in postage, printing and staff overhead, and hangs its only derivation off that one: savings reported by respondents who had cleaned up name-and-address data, scaled by Dun & Bradstreet counts of U.S. businesses by headcount [6]. It never reconciles the pair. The economical reading is that they are one estimate, rounded for the executive summary, and that reading is mine rather than the report's. What you cannot do is treat them as two findings that corroborate each other, which is how they have circulated for twenty years.
That report is not an early sighting of the money argument. It is the money argument finished. Beside the headline figure sits a worked funding case, $130,000 in annual savings on a $70,000 outlay, a 188 percent internal rate of return, payback in months. Respondents name "a single version of the truth" among the benefits they got. A warning says HIPAA and the Bank Secrecy Act are "upping the ante" on customer data [6]. Three of my four arguments. One document. Before the statute that supposedly opened the first.
So these were never stages. Compliance, cost and capability are three faces of one case, assembled by February 2002, and the two decades since have re-weighted them rather than added to them. Whichever driver carried that year's deadline went to the front of the deck. I take them here in the order easiest to explain, which is not the order they arrived.
You can disagree with that method. More to the point, you can check it. The genre it launched still runs, the same slide with a fresher figure, and Gartner now puts the cost of poor data quality at an average of at least $12.9 million a year per organization [7]. Quantified waste is a more honest argument than vague risk. It is also where the trade picked up the habit it has never shaken, which is treating the headline number as the argument rather than the doorway.
The third face flatters us most. A single view of the customer became money at the top of the income statement rather than savings at the bottom, because you cannot cross-sell on four contradictory versions of one person. A 2013 paper from the University of St. Gallen still lists regulatory compliance, reporting "in the sense of a 'single version of the truth,'" and the 360-degree customer view as concurrent drivers [8]. Eleven years on, the same three, still concurrent.
The bet does appear to pay, at one remove. Brynjolfsson, Hitt and Kim, on 179 large publicly traded firms, reported output and productivity 5 to 6 percent higher among adopters of data-driven decision-making than their other investments would predict [9]. That is a finding about deciding from data, not about master data management, and I will leave it there. That buyers moved from exposure to capability I have watched happen and cannot hand you a source for. The figures that circulate trace through a trade write-up [10] to a 2021 Magic Quadrant [11] which, read in full, does not contain them.
And capability carried a tax. Sell the platform as the enabler of everything and it gets easy to assume the software carries the ownership work. The pitch got more exciting. The discipline got easier to skip.
The fourth argument, and the half of it that is not mine
Disclosure, before I argue this next part. The practice behind this publication is a Profisee implementation partner, certified to deploy that product for clients. Those clients pay us for the deployment work. The vendor does not pay us for the sale. That is the narrow truth, and here is the wider one: our services revenue is downstream of this category of software being chosen at all. What follows argues that entities should be resolved deterministically and once rather than left to the model, which is an argument for buying the category we are paid to deploy. Weigh the criticisms in it above the praise.
Everyone now needs data that is "AI-ready," and a model is only as trustworthy as the master data under it. Feed one four versions of your biggest customer and it answers with the serene confidence of one.
Look hard at what Gartner's own account of AI-ready data asks for. Reliable sources and pipelines. Lineage, meaning "transparency about data origins and transformations." Stewardship policies applied "throughout the data life cycle." Validation and verification "during development and operations." Observability of data health, timeliness and accuracy [12]. Most of that is the master-data case. AI did not invent the argument. It inherited it and stapled a deadline to it. And notice what is not on the list. Nowhere does it ask you to resolve those four versions into one. That absence is where the bill comes due.
Most of it, then, and the remainder deserves naming, because it genuinely was not in the first three. The same page declines to call any dataset AI-ready in the abstract. Readiness "depends on how the data will be used," and there is "no way to make data AI-ready in general or in advance" [12]. Stack on the labeling, the drift versioning, the regression testing and the bias measures, and you have real work, none of it master data management.
There is a sharper point against me on the same page. High-quality data, judged the traditional way, "does not equate to AI-ready data," because an algorithm needs data representative of what it will meet, and that "may include poor-quality data, too" [12]. Survivorship is the work I have spent a career defending. For a training set it is also a way of deleting the variance the model was supposed to learn from. The golden record is the right artifact for a payment run and the wrong one for a sample. That fourth argument has a second half, and it belongs to somebody else.
Where I want to push back is on the bill, and I owe this one to my co-author, who put it more plainly than I had:
I haven't read the Gartner report, but any report that says 'AI ready data' is (functionally) unchanged from your source systems isn't asking for any work to 'prepare' the data for AI. They're just asking that the AI be fed garbage data and expected to correct it. That's expensive in tokens when compared to basic MDM pre-processing.
He flagged that he had not read it, and he was right to say so. Having read it, I owe the page more: it asks for real work, as that list shows. What survives is the half of his objection aimed at what the page never asks for, and it survives because the page reaches further than he knew. Where it argues representativeness at length, the case is about training [12]. Its definition goes past its argument. Data must be representative "to train or run an AI model for a specific use" [12]. Run, not just train. The enterprise work I see is running. At inference nothing is being fitted, so four versions of your biggest customer teach nobody anything. They arrive in the context window, and something reconciles them on every query at token prices, or nothing does and the answer comes back from whichever version came first.
Notice what the page does that its market does not. It defines its terms. What gets sold downstream is "advanced AI processing," and I have yet to be handed two proposals that meant the same thing by it. That is my experience rather than a census, and the asymmetry survives either way, because it takes one undefined term to do the damage. You cannot cost an undefined thing, scope it, or hold anyone to it. Ask for the definition before the quote.
That is the trade I would put in front of a committee. Resolve the entity once, upstream or in the view that serves the model, but once and deterministically, and you pay for it once. You can read the rule that decided it, change it, and see what moved. A reconciliation inside a context window leaves no such artifact. The obvious objection is that prompts version too and traces log, and that is true, and none of it is the same artifact. A trace tells you what went in and what came back. It does not tell you which rule decided these two records were one person, because no rule did.
Answer quality is the other half, and my co-author has the image for it. An analogy, not an anecdote. Train a model on raw sewage and you do get a lift, and the lift is real. But the defence of feeding it the mess rests on the mess being representative of what the model will meet, and sewage is not representative of drinking water. Here is the narrow claim I will defend. Not that a resolved entity always answers better. That "representative" has not earned its keep, because an unresolved customer record is not a truer sample of your business. It is the same fact four times, weighted by whichever system was chattiest.
Ship the mess downstream and call it representativeness, and you have turned a fixed preprocessing cost into a variable per-query one, at a unit price you neither set nor forecast. I cannot hand you the crossover figure. It turns on your query volume, your model, and a token price that moved twice while this was edited, and I am not inventing one to win a paragraph. But the shape of the two costs differs, and a case that ignores that is not a case about money.
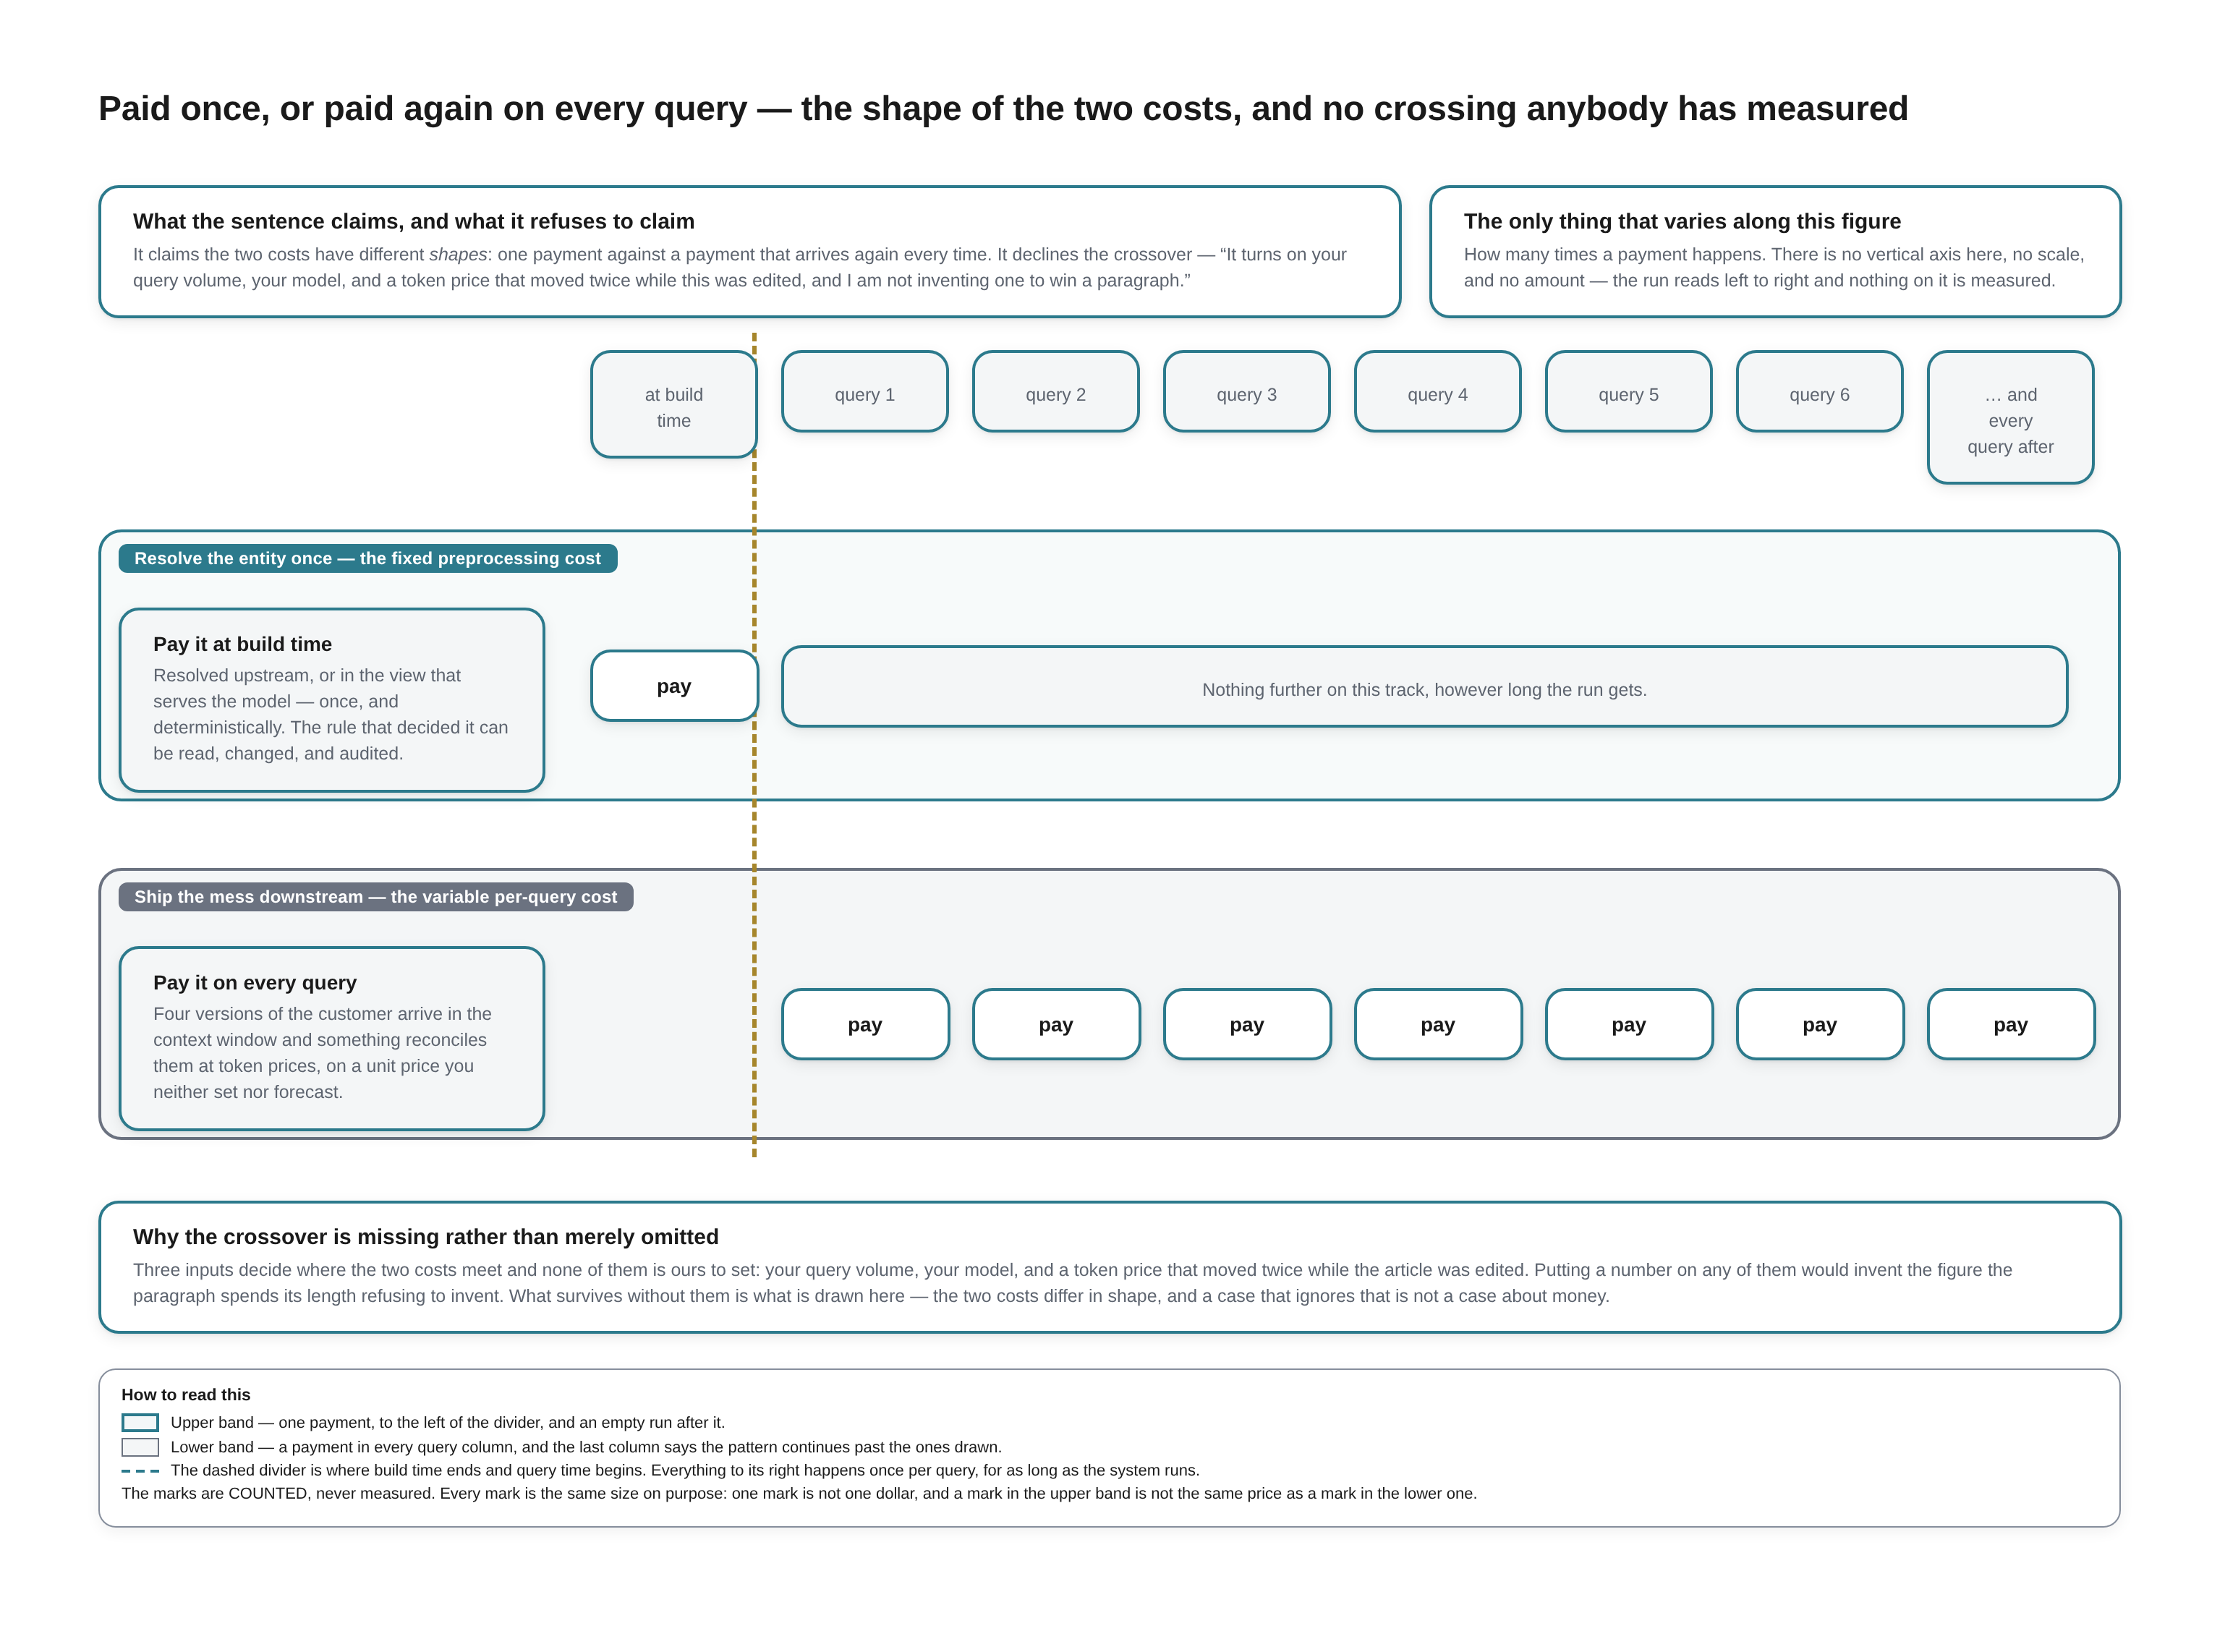
Paid once, or paid again on every query — the shape of the two costs, and no crossing anybody has measured.
Two panels head the figure. What the sentence claims, and what it refuses to claim. It claims the two costs have different shapes: one payment against a payment that arrives again every time. It declines the crossover — “It turns on your query volume, your model, and a token price that moved twice while this was edited, and I am not inventing one to win a paragraph.” And the only thing that varies along this figure. How many times a payment happens. There is no vertical axis here, no scale, and no amount — the run reads left to right and nothing on it is measured.
Eight column headings run across the top: at build time, query 1, query 2, query 3, query 4, query 5, query 6, and … and every query after. A dashed vertical divider falls between the first heading and the second.
- Upper band — resolve the entity once, the fixed preprocessing cost. Its note reads: Pay it at build time. Resolved upstream, or in the view that serves the model — once, and deterministically. The rule that decided it can be read, changed, and audited. One box reading “pay” sits in the build-time column, to the left of the divider. Across the whole run to its right sits a single strip: “Nothing further on this track, however long the run gets.”
- Lower band — ship the mess downstream, the variable per-query cost. Its note reads: Pay it on every query. Four versions of the customer arrive in the context window and something reconciles them at token prices, on a unit price you neither set nor forecast. A box reading “pay” sits in every one of the seven query columns — pay, pay, pay, pay, pay, pay, pay — and the build-time column is empty.
Why the crossover is missing rather than merely omitted. Three inputs decide where the two costs meet and none of them is ours to set: your query volume, your model, and a token price that moved twice while the article was edited. Putting a number on any of them would invent the figure the paragraph spends its length refusing to invent. What survives without them is what is drawn here — the two costs differ in shape, and a case that ignores that is not a case about money.
How to read this. Upper band — one payment, to the left of the divider, and an empty run after it. Lower band — a payment in every query column, and the last column says the pattern continues past the ones drawn. The dashed divider is where build time ends and query time begins; everything to its right happens once per query, for as long as the system runs. The marks are COUNTED, never measured. Every mark is the same size on purpose: one mark is not one dollar, and a mark in the upper band is not the same price as a mark in the lower one.
Two objections belong here, this being the part likeliest to be wrong. The page is not silent on cost: it asks that data meet operational service levels "including response time and cost efficiency" [12]. That names the bill without saying who pays it down, and I would rather quote it than pretend otherwise. The second is aimed at me. A model handed all four versions can notice they disagree. A survivorship rule cannot. It picks one, records the win, and the disagreement stops being visible downstream. Reconciling per query is expensive, but expensive in the open, and if your merge logic is quietly choosing wrong that may be the cheaper error. My answer is thin. A conflict surfaced fresh on every query is still a conflict nobody owns.
And a wrinkle the enthusiasm hides. A great deal of AI spending is not a return-on-investment argument at all. In the rooms I have sat in the return is negative and everyone knows it, and the case is a response to market and competitor pressure. A legitimate reason to spend money, and a different argument. Regulatory work has always lived there, and the Section 404 figures measure exactly that [5].
The Running Book
The argument stops here. What follows is operating experience: how one of these cases actually gets built, argued, funded and stalled. The register changes with it, essay to briefing, and briefing prose states things flat. They are patterns rather than laws, drawn from the rooms I happened to be in, and I cannot hand you a way to falsify them.
Hits
- Size it before you shape it. The first question is whose problem you are solving, and the honest range runs from keeping a capable team busy for a quarter to a statute that just cleared Congress. Then you put a rough order of magnitude around it, or, if the calendar is against you, a scientific wild-ass guess. Both answer the same question, which is what size of thing is on the table, and the size tells you how hard you will have to argue for it.
- Tailor per approver, the way an advocate works a bench. A lawyer before a high court does not write one argument. They know which members are moved by which doctrine, and they frame around it. A funding committee runs on the same mechanism. Give marketing a reason of its own to sign on, because with nothing in it for marketing, marketing is a coin flip. Keep legal in view too. New exposure that is not a core requirement draws pushback unless you arrive already answering it.
- For the chief financial officer there are exactly two numbers, and nothing to add. Cost, and anticipated return. Those are the two he cares about. Sometimes the return is negative and the job is to minimise it, and you say so plainly, because the room can tell. What matters more is whether the figures tell a story a reasonable person can follow. They get the case read. They do not decide it. He holds one seat, and the seats beside him ask whether this organisation can absorb the work, who owns it after handover, and what it displaces on a plan already full.
- Run a proof of concept down the whole line from day one. Not the risky component. The entire path, however thin. All three stall shapes below yield to the same move, which is turning the crank early so the obstructions surface while there is budget and calendar left to route around them. The least glamorous advice in the discipline, and genuinely hard: it means speed-running the project without burning the contingency, on a team good enough that your best people can trail-blaze while the rest implement with little direction. Pull the vanguard back to help and you have lost the advance and clumped the delivery.
Four steps, and the two that decide it are the two you are not picturing. I put the question to my co-author, who has carried more of these into more rooms than I have. What came back was a sequence rather than a template:
(1) Figure out what you need to do, then — usually immediately after — what you want to do. (2) Figure out roughly how long it will take and what it will cost. (3) Shape the case to appeal to the needs of the company and of the specific members of the approval group. (4) Last thing in is the candy: low-hanging fruit that would be great to get done, doesn't move the timeline much, and can win support from business groups outside the core ask.
Three and four are where cases are won, and they are the two that get cut when the calendar tightens. Keep the pieces separable while you do it. Committees rarely say yes or no. They say yes to some of it, and a case built in separable pieces recomposes around that answer. What got funded is your minimum viable product. What got cut is your backlog, already scoped and costed.
Misses
- Skipping steps three and four together. The least experienced managers do it, and so do experienced ones under pressure. They focus on the deliverable and never build the case around it. Asked why those two go first, my co-author named the assumption underneath: The work being obviously worth doing is not an argument; it's an assumption that the room already agrees with you. It usually does not. Or it agrees, and funds the person who did not skip those steps.
- Filing exogenous change as somebody else's problem. Funded programmes stall in one of three shapes, and naming them matters because the mitigations differ. The first is scope creep, which almost never means a stakeholder asking for extra features. It is requirement change arriving from outside: restructuring, architecture, regulation, security. You scoped on a platform that was a reasonable call at the time, and three months later a researcher publishes a zero-day and security scraps it inside the week. Or a new director arrives and the shop moves clouds, and yours joins the migration list mid-build. I used to file those as external events rather than scope creep. That was wrong. Each one propagates into every in-flight programme, and if it changes what you must build it is scope creep whatever the org chart calls it.
- Planning around a feature that has not shipped. The second shape is incorrect technical assumptions, and it catches the teams who like new technology. Marketing advertises niche capabilities broadly, and whole projects get planned around something six months from release. Connecting one system to another with a newly announced integration layer? Prove it has connectors for both, inside your window, before the plan hardens. This bites hardest when the platform lands in phase two, because then nobody inspects what it actually delivers until the plan is carrying weight.
- Reading dependency drag as bureaucracy. The third shape is the approval gate that convenes intermittently: architecture review, security sign-off, data classification. It is not red tape. Those boards are staffed from other active projects, and the advisory seat is nobody's day job. A gate that slips slips the dependency, and the dependency slips the programme. Same shape when a production problem takes the team for three days, because most programmes run on people who also carry production support. Complaining about it in a status report has never moved a date.
- Not knowing where the hard part starts. Months four to six is the inflection point. Either the thing is wrapping up or it is getting into the meat, the low-hanging fruit is gone, and the thorny work is all that is left. That is why the second and third increments are the rough ones. A team that had just found its rhythm goes back to arguing about basics.
The Unwritten
These recur constantly and seldom survive the trip into a best-practices document, because admitting them looks bad.
- The headline number is an extreme, and everyone quoting it knows. It is a worst case or a best case depending on who is holding it up. Your organisation lands somewhere between, and no published figure tells you where. Good for opening a conversation. Useless for closing one.
- The number that kills a project is the one with nothing underneath it. The quickest route to a tabled proposal is a member asking where a figure came from and getting silence. Not a weak answer. No answer. And what dies with it is the room's willingness to believe everything in the case that had nothing to do with money: the timeline, the staffing, the claim you understand the systems. Every non-financial assurance gets re-read as decoration. So tie the programme to a number the business already tracks, and show your work the way that 2002 report showed its. Twenty years on, the trade still has not copied it.
- Ownership is something a programme reveals, not something it solves, and I lean hard on the first verb. Solving anything takes buy-in, support, effort and, above all, enforcement. Build all the intelligence you like into a system. If the business has to route around it to keep the doors open, it will, and it should. I have never seen an organisation solve systematising its own delivery. Systematising only relocates the problem. Fix ingestion and it surfaces that the groups downstream have their own trouble. Build the reporting layer and the ground under it turns out softer than anyone had checked. Layers all the way down, and people spend whole careers peeling them back and then hand the job to a successor. Outsourcing infrastructure was the last instance. AI is the next. Very little of it survives into a business case, because a case has to promise an end state and there is not one.
- I am not going to give you a number from my own work, and the reasons are the point. This is where a piece like this usually produces a personal figure. An efficiency gain, a percentage. I do not have one. I am rarely in the financial decisions, and hard financials sit behind security, privacy and data classification. Much of what I have done created process where none existed, so there is no A/B to compare against. And the assertion would be unfalsifiable. You could not check an order-of-magnitude efficiency claim without me handing over proprietary and customer-identifying information, which I will not do. If I cannot make the case that I am worth the money without leaning on rough orders of magnitude and wild guesses with a decimal point on them, I am probably not the right fit.
A threshold is a fact about the organisation that set it, and only incidentally about money. I had this written as though the figure decided. My co-author took it apart:
While there's always a number, I'll fight about the number ever being the only factor. It's always one of a bunch of factors, even if it's the 'leading' one. Even in situations where companies establish 'thresholds,' those thresholds are established for other reasons than pure monetary figures—not the least of which might be they don't have that kind of money in the first place. Obviously if someone needs a trillion dollars to implement something, anyone other than Governments or Musk are going to reject it out of hand, but that's not because of the dollar figure—it's because of the infeasibility for them being the ones to do it in the first place.
A case refused for being enormous was almost never refused on the digits. It was refused because this body is not the kind that can do that thing. Not the balance sheet, not the appetite, not the people. Which matters, because "we cannot afford it" is a wall and "we are not the ones to do this, this year" is a shape you can argue with. Resize it. Resequence it. Find the sponsor whose mandate it actually falls under. The number tells you which conversation you are in. It never has the last word.
What you are actually selling
Back to the argument. Every version of this case has blamed the tools, and every version has been mostly wrong. Master data breaks in the org chart, not in the diagram, as I learned watching two databases everyone swore were spotless merge into one memorable mess. The clean model saved nobody. The unanswered question of who decides did the damage. The outside sources reach it independently: St. Gallen naming early programmes as technology-driven at the cost of the organisational work [8], and the Kimball Group, from data modeling, concluding that shared reference data "requires organizational consensus and commitment to data stewardship" [3]. Everyone who gets there gets there by exhaustion.
The golden record is a verb, not a noun. Survivorship runs forever, because the world keeps changing your customers, products and suppliers whether anyone is watching. Budget for the tending. The build is the cheap part.
The version of this that ran here before is kept whole and unedited at its own page if you would like to read the two side by side, and the case study sits next to it.
Which is why the thing you are actually selling is not the end state. It is a joint, in the anatomical sense: it permits motion and carries load, and does both only inside a range somebody named. Unbounded motion is dislocation. What a funded programme buys is enough articulation to absorb the restructure, the regulation and the platform swap already on their way, and enough load-bearing to be worth the money while it waits. Nobody delivers perfect. Good enough, and configurable enough to change, is a case a committee can approve, and I have been making that argument for thirty years with results I would call mixed. The argument was never the part that failed. The part that failed is the one nobody was asked to fund: who decides, after the money is gone.
Correction. Updated August 22, 2026. An earlier version of this piece called the 2002 TDWI report's two figures "a subset larger than the whole" — $611 billion for poor-quality customer data set against "more than $600 billion" for all data quality problems. That was wrong on its face, because $611 billion is more than $600 billion, and the sentence made the report look self-refuting when it is not. The passage has been rewritten. Two things we then got wrong in the fix and are correcting here rather than leaving quiet: the replacement dropped the report's own word customer, which is the scope difference that makes the pair confusing in the first place; and it asserted the two figures are one estimate as though the report said so. It doesn't. That is our reading, and it now says it is one.
Why we missed it. Our blind reviewers were handed the article's text without its sources. Two of them read that passage and neither could settle it, because the evidence sat outside the text and the instrument could not reach it — a reviewer who cannot open a citation cannot catch a misread one. Reviewers now get the full reference list with working links, are told to open whatever they doubt, and open each figure's image file rather than our description of it. The first reviewer equipped that way found both of the errors named above, in the correction itself.
What the byline means. Elias K. is an AI persona; the argument and the prose are his. The operating experience in The Running Book is not. It comes from Jeff Shabel — drawn out in interview before this was written, and sharpened by the corrections he made after reading it. Every passage quoted here is his own words. He edited the result.
References
[1] DAMA International, DAMA-DMBOK: Data Management Body of Knowledge, 2nd ed. (Technics Publications, 2017), ISBN 978-1-63462-234-9, ch. 10, "Reference and Master Data" — the field's reference work on master-data domains, the trusted source and golden record, and the single-version-of-the-truth framing.
[2] David Loshin, Master Data Management (Morgan Kaufmann / The MK-OMG Press, 2008), ISBN 978-0-12-374225-4, Preface, pp. xix–xx. The quoted sentence appears in the Preface, which also names "increased regulatory oversight, increased need for information exchange, business performance management, and the value of service-oriented architecture" as the drivers converging on master data management — a contemporaneous statement of the compliance case by a practitioner writing at the time. Read from the publisher's own sample front matter. https://booksite.elsevier.com/samplechapters/9780123742254/Sample_Chapters/01~Front_Matter.pdf
[3] Margy Ross, "Design Tip #135: Conformed Dimensions as the Foundation for Agile Data Warehousing," Kimball Group, June 1, 2011 — defines a conformed dimension as "descriptive master reference data that's referenced in multiple dimensional models," warns that similar labels can mask differing underlying business rules, and states that defining one "requires organizational consensus and commitment to data stewardship." https://www.kimballgroup.com/2011/06/design-tip-135-conformed-dimensions-as-the-foundation-for-agile-data-warehousing/
[4] Sarbanes-Oxley Act of 2002, Pub. L. No. 107-204, tit. IV, § 404, 116 Stat. 745, 789 (July 30, 2002), codified at 15 U.S.C. § 7262. https://www.law.cornell.edu/uscode/text/15/7262 The statute directs the SEC to write the rule; the operative requirement and the term of art “internal control over financial reporting” come from U.S. Securities and Exchange Commission, "Management's Report on Internal Control Over Financial Reporting and Certification of Disclosure in Exchange Act Periodic Reports," Final Rule, Release Nos. 33-8238; 34-47986; IC-26068, adopted June 5, 2003, effective August 14, 2003; 68 Fed. Reg. 36636. https://www.sec.gov/files/rules/final/33-8238.htm
[5] Office of Economic Analysis, U.S. Securities and Exchange Commission, Study of the Sarbanes-Oxley Act of 2002 Section 404 Internal Control over Financial Reporting Requirements, September 2009 — mean total Section 404 compliance cost of $2.87 million pre-reform and $2.33 million post-reform among Section 404(b) filers (p. 4); reported benefits of 73% (internal control structure), 71% (audit committee confidence), 49% (financial reporting quality) and a majority-negative assessment of the overall cost-benefit trade-off (p. 6). https://www.sec.gov/news/studies/2009/sox-404_study.pdf
[6] Wayne W. Eckerson, Data Quality and the Bottom Line: Achieving Business Success through a Commitment to High Quality Data, TDWI Report Series, The Data Warehousing Institute, February 2002 — "more than $600 billion a year" in the Executive Summary (p. 3); "$611 billion a year in postage, printing, and staff overhead" for poor-quality customer data, with the derivation given in footnote 1 as respondent-reported cost savings from name-and-address cleanup scaled by Dun & Bradstreet counts of U.S. businesses by number of employees (p. 5). The two figures are not reconciled in the report; both are quoted here as published. http://download.101com.com/pub/tdwi/Files/DQReport.pdf
[7] "Data Quality: Why It Matters and How to Achieve It," Gartner — poor data quality costs organizations at least $12.9 million a year on average (Gartner research, 2020). https://www.gartner.com/en/data-analytics/topics/data-quality
[8] Andreas Reichert, Boris Otto and Hubert Österle, "A Reference Process Model for Master Data Management," Wirtschaftsinformatik Proceedings 2013, paper 52 (11th International Conference on Wirtschaftsinformatik, Leipzig, 2013), pp. 817–830 — business drivers and the technology-driven-to-organizational shift are stated in §1.1, pp. 817–818. Produced by the Competence Center Corporate Data Quality at the University of St. Gallen. https://aisel.aisnet.org/wi2013/52/
[9] Erik Brynjolfsson, Lorin Hitt and Heekyung Kim, "Strength in Numbers: How does data-driven decision-making affect firm performance?" ICIS 2011 Proceedings, paper 13 — 179 large publicly traded firms; output and productivity 5–6% higher among adopters of data-driven decision-making than their other investments and IT usage would predict. Cited to the published abstract on the publisher's repository record; the deposited PDF carries no extractable text layer, so this reference does not rest on a full-text read. https://aisel.aisnet.org/icis2011/proceedings/economicvalueIS/13/
[10] Thor Olavsrud, "What is master data management? Ensuring a single source of truth," CIO, May 31, 2021 — the trade write-up the figures travel through. It reports that "organizations pursue MDM for a variety of reasons; among the most popular are to create internal/operational efficiencies (69%), to improve business process outcomes (59%), and to improve business process agility (54%), according to Gartner’s Jan. 2021 MDM Magic Quadrant." Page read in full 2026-08-17. https://www.cio.com/article/191827/what-is-master-data-management-ensuring-a-single-source-of-truth.html
[11] Gartner, Magic Quadrant for Master Data Management Solutions, 27 January 2021, ID G00466922 — the document those figures are attributed to. A full-text search of the complete licensed-for-distribution reprint (1-253RHWIZ, 30pp) returns no occurrence of 69%, 59% or 54%, and the document does not discuss reasons for pursuing MDM at all; the percentages it does contain are 35, 5, 80, 95, 40, 16, 21, 1, 7, 6 and 28. Gartner has retired the document and its public landing page now redirects to the Gartner home page, so there is no live URL to give you — cited by title, date and document ID so that anyone with Gartner access can check the claim. Verified 2026-08-17.
[12] Rita Sallam, "What Is AI-Ready Data? And How to Get Yours There," Gartner — the source of both quoted sentences: "There is no way to make data AI-ready in general or in advance. The readiness of data for AI depends on how the data will be used," and "‘High-quality’ data — as judged by traditional data quality standards — does not equate to AI-ready data… the algorithm will need representative data. This may include poor-quality data, too." The same page's requirement list runs to semantics and labeling, quantification, diversity, versioning for model drift, continuous regression testing, observability, and bias and fairness. Read in full, in a rendered browser, 2026-08-18. https://www.gartner.com/en/articles/ai-ready-data