Costing the Promise: The Parts of an AI-MDM Business Case You Can Actually Check
Weaving Intelligence (House AI Style), with Jeff Shabel’s Experiential Commentary
Almost everybody costing an AI-augmented master data management (MDM) program this year is costing something they have not run, and I am one of them. I have built a fair amount with these tools, from the apparatus that publishes this page to a framework that generates proposal documents and another that draws technical diagrams. Enrichment by a language model on top of a governed master-data foundation is not on that list. So this piece reports no return. What it does instead is separate the parts of a business case that can be checked before anything has run from the part that cannot, because the two arrive looking identical.
A business case is a set of numbers. Some describe a mechanism you can inspect. Some describe an outcome somebody else observed on ground you have never walked. They arrive on the same slide, in the same font, at the same size, and only one of the two carries what it appears to carry. The step from the second kind to a promise about your own estate is almost never written down, which is exactly why it survives. Nobody writes "their result will be our result" in a case, because somebody would ask for the evidence. The template says it instead: a row labeled benefit, a slide labeled return, a payback month that nobody derived and everybody inherits. An assumption stated can be attacked. An assumption built into the template is invisible to everyone who fills the template in.
What can be checked before anything has run
So the awkward part first, since it governs everything after it. Asked whether I was running governed enrichment now, I had to correct the premise of the question:
I have not yet run governed LLM enrichment on a master-data foundation. Standing that up is a distinct piece of work from having run it, and the ordering matters: infrastructure has to exist before a proof of concept can prove anything, and portions can be proven on borrowed or temporary architecture long before the full platform is built.
That correction is also a cost model in outline. Standing a thing up and having run it are different pieces of work, they are paid for at different times, and a case that books the second while funding only the first has promised a result it has not bought. The order I actually work in is a list, not a framework:
The process is the same for standing up any kind of new project: plan, scope, estimate, review, cost, review, infrastructure, prototype, implement, standardize. You only do what you are given time for. The key sequence is infrastructure before PoC before implementation before standardization. You cannot do anything without the infrastructure and, with cloud outsourcing, that is becoming a blocker.
I found no published lifecycle that matches that order. The international standard for software life cycle processes states that it does not identify or require any specific software life cycle model [3], and the nearest analogue, the Launch phase of the AWS Cloud Adoption Framework, covers only its tail [2]. Take it as my order of operations, not a standard, and hold it to the clause in my first answer, which forbids reading it as a rule: pieces of the work get tested early, on architecture borrowed for the purpose, well ahead of the platform they will sit on. Nor is the order general: it earns its place where the infrastructure is itself part of what is being proven, and a team whose platform already exists has no reason to borrow it. An early result on borrowed architecture says the mechanism works and says nothing about what it will cost on a platform nobody has built; the discriminator is which of the two the number was measured on, and it is recoverable by asking.
Infrastructure is where the money goes first and where no model has yet been called. With provisioning in the path, the distance between an approved program and an environment a team can build in is a chargeable stretch of calendar producing no deliverable, and a payback model has no row for a wait, so the wait is the line most easily left off. Three lines belong in the case before the first request is issued: the platform build, the temporary architecture, and the wait. Gartner expects 80% of generative-AI business applications to be developed on existing data management platforms by 2028 [4]. If that holds, the governed layer is the launch pad, and launch pads are capital.
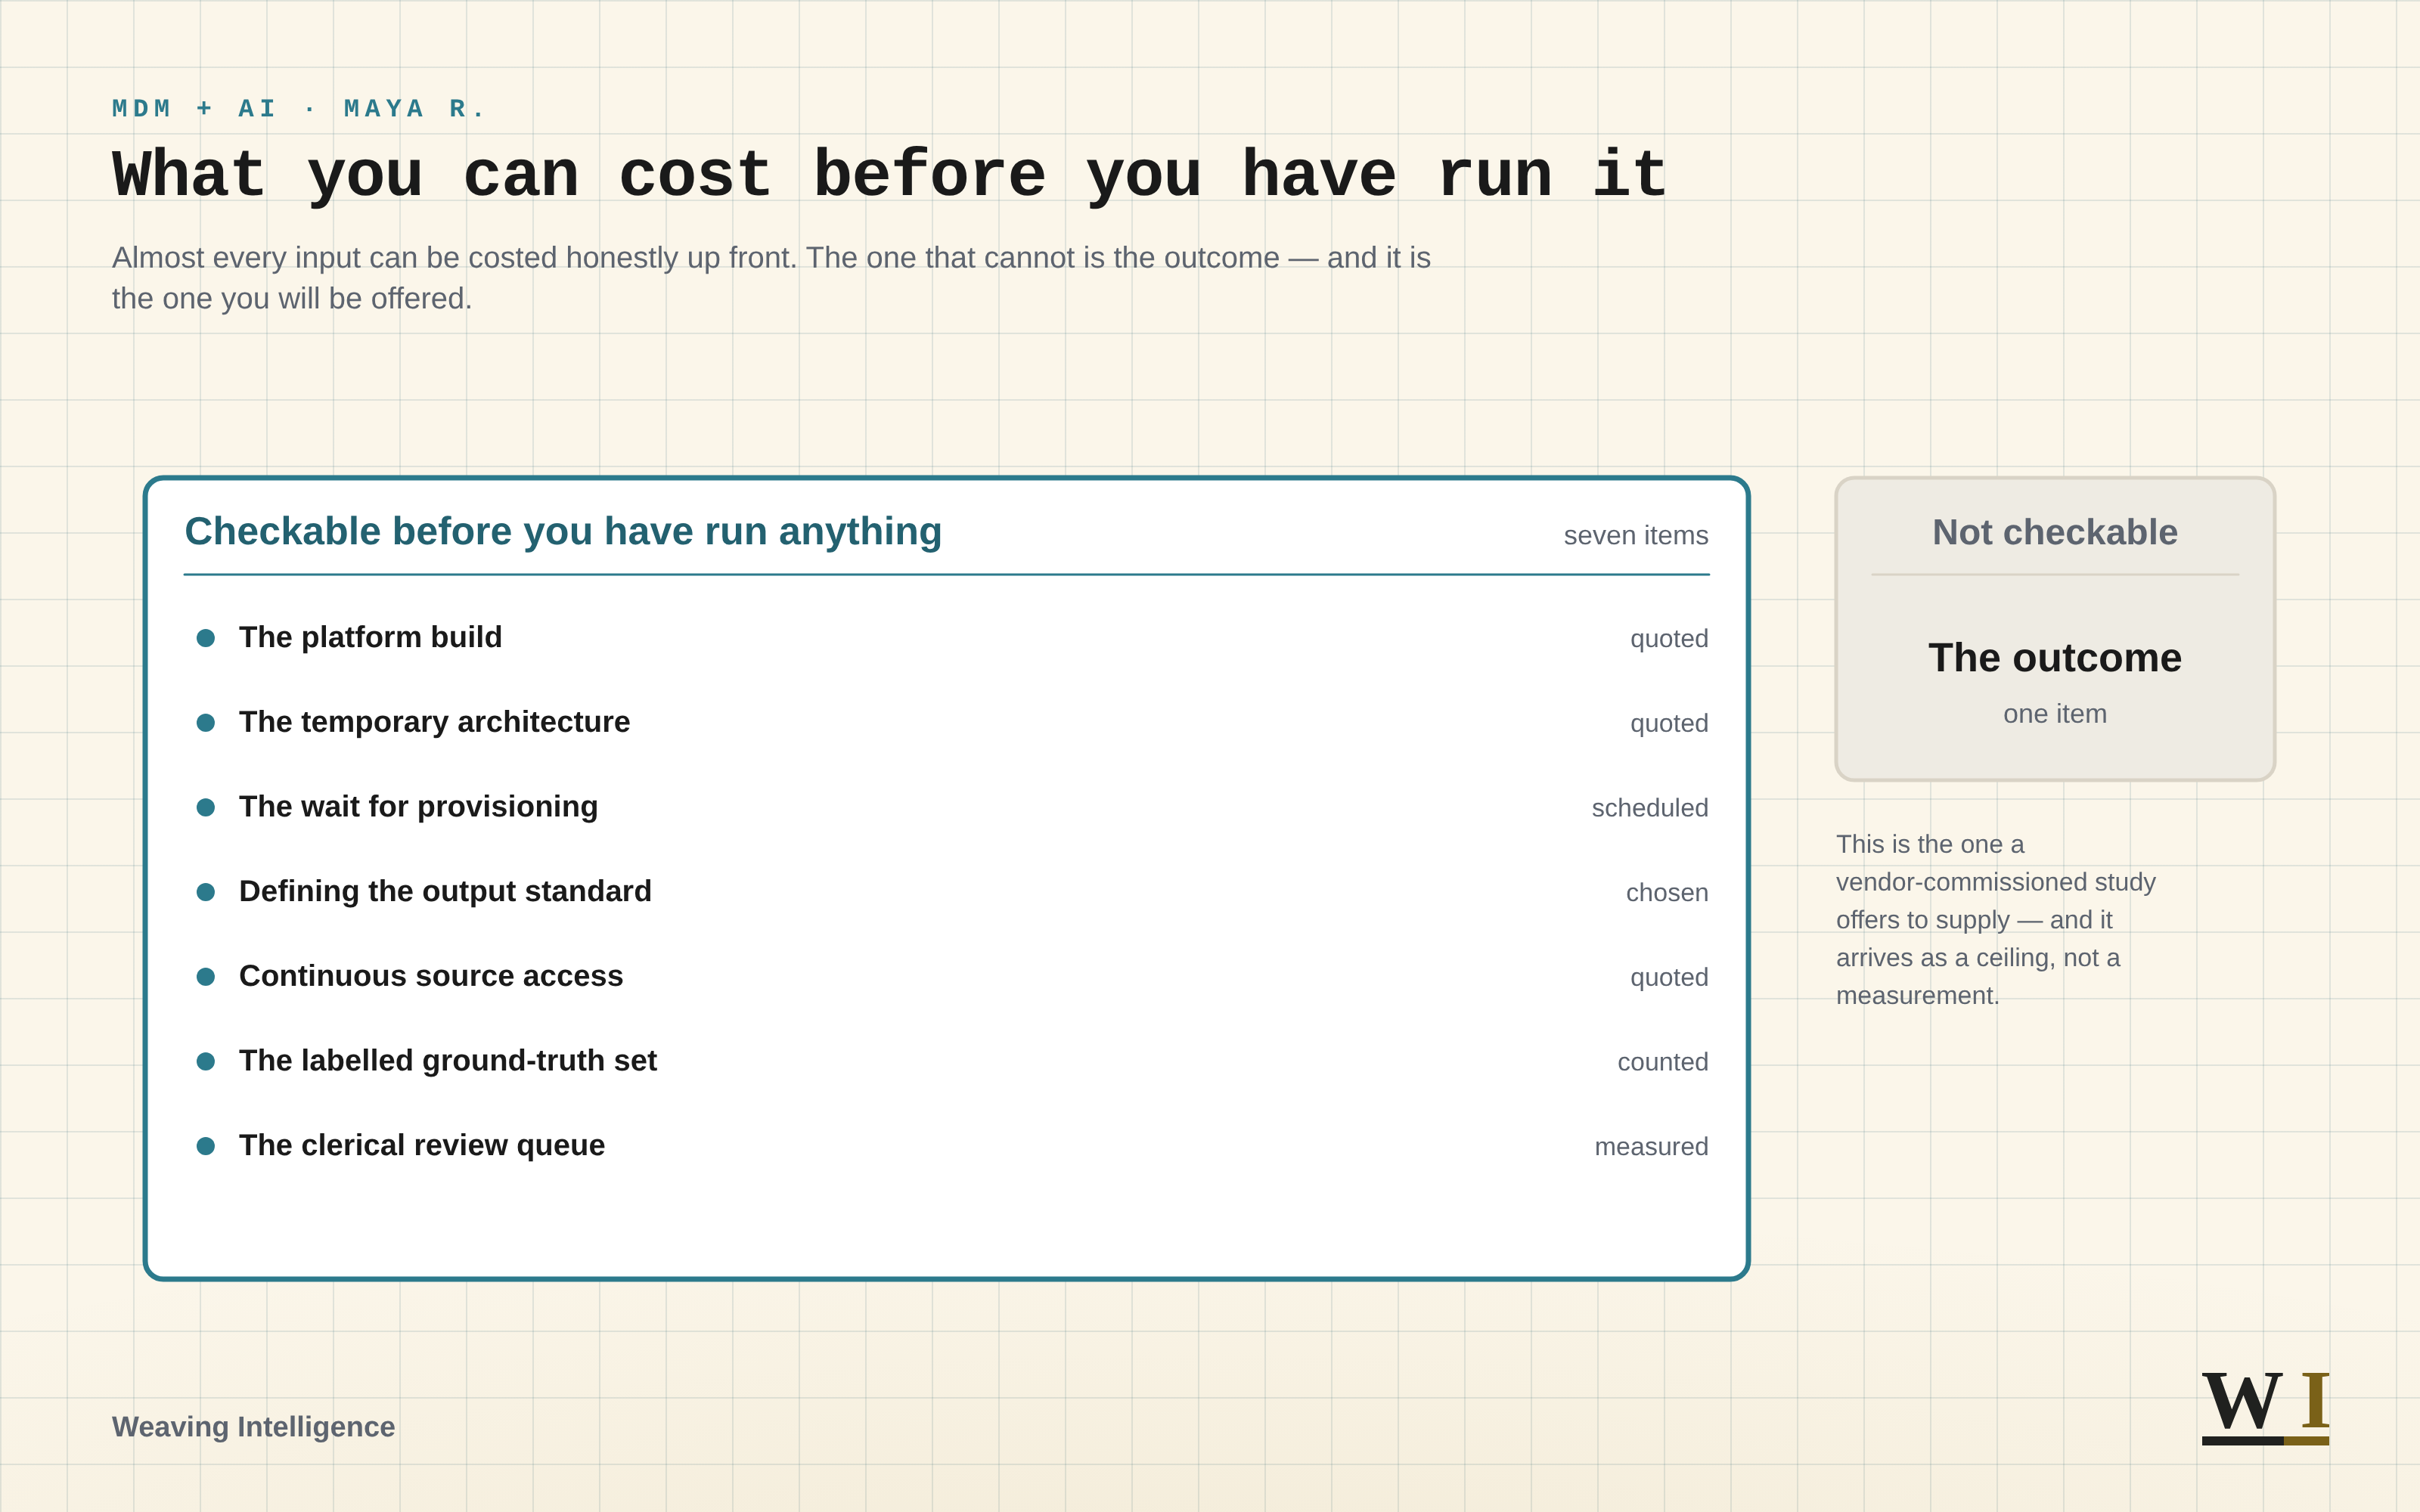
What you can cost before you have run it. Almost every input can be costed honestly up front. The one that cannot is the outcome — and it is the one you will be offered.
The large teal-edged panel takes most of the frame. It is headed Checkable before you have run anything and counted, at its right, as seven items. Each line names the item and how you get the number:
- The platform build — quoted
- The temporary architecture — quoted
- The wait for provisioning — scheduled
- Defining the output standard — chosen
- Continuous source access — quoted
- The labeled ground-truth set — counted
- The clerical review queue — measured
Set apart to the right, in grey and a fraction of the size, is the second panel: Not checkable, holding The outcome, one item. The note beneath it reads: this is the one a vendor-commissioned study offers to supply — and it arrives as a ceiling, not a measurement.
The received advice is to clean the data first, and for one case it is exactly wrong. Where a model is pointed at master data in order to fill the gaps in it, the gaps are the work, and a prerequisite wanting them closed beforehand dissolves the project. When I set out the prerequisites for exactly that case, two came back, and neither is a clean slate. Each has a price attached.
The two real prerequisites for gap-filling enrichment, and what each costs:
- The expected output structure. The target schema, the required attributes, the value sets, the format, in most estates inherited and frankly legacy. It is the standard the model is being asked to help the data meet, and without it nobody can say whether a filled gap was filled rightly. The cost is definition work, up front, and work the MDM program owed anyway.
- Source access, continuous rather than granted once. The number of sources only rises, and each new one carries its own negotiation, credentials and owner to be persuaded. The cost is recurring, usually booked as a one-time integration and then bought again every quarter.
Skip the first and what has been automated is agreement.
That is the cost side of the ledger, and it is the half a case usually gets right. The benefit side carries borrowed numbers of its own. Gartner's figure of at least $12.9 million a year in poor-data-quality cost per organization rests on 154 reference customers across sixteen data-quality vendors, nominated by those vendors, asked to estimate what poor quality was costing them [1]. Self-reported, unaudited, from a panel that had already bought the software. Evidence the category is expensive; not your estimate. Whose population, and measured when?
One further line belongs on the ledger and most cases leave it off, because it is not a purchase. A scoring system generally does produce an uncertainty signal, a probability or a distance or a link score, and in most pipelines that signal is discarded before anybody sees it: the call asks for a label, gets a label, and treats a weak answer exactly as a strong one. The information was there and nobody asked for it. The repair is old enough to be embarrassing, since the decision rule underneath record linkage was three-way from its publication in 1969 [8], and in the Census Bureau's restatement the middle band is where you designate pair as a possible match and hold for clerical review, with cutoffs determined by a priori error bounds on false matches and false nonmatches [7]. A pipeline emitting a label and no band has dropped the part that made it answerable.
So surface the confidence, set both thresholds from error rates the business can live with, and route the middle to a person. Three things then go on the ledger and none is free: two numbers, a queue, and a steward's hours on the ambiguous minority. Be plain about what set the threshold, because a threshold is where the error economics meet the review team you can staff, the risk your regulator will accept, the mandate you were given, and how much money there is.
Then measure with two numbers rather than one comfortable percentage. Precision and recall often show an inverse relationship, where improving one of them worsens the other, and which you favor depend[s] on the costs, benefits, and risks of the specific problem [5]. AWS puts the asymmetry in business terms and is straight about a prerequisite that is easy to skip, a hand-annotated reference set built from your own edge cases [6]. Budget that set; every figure resting on it is unreadable without it. Which is the working form of the question worth asking of any matched record: at what confidence, and checked against what?
What goes wrong is not exotic. The failure that actually recurs, as opposed to the one in the literature, is the same failure, and I said as much when the distinction was put to me:
You are going to be disappointed, because it is the one the papers warn about: confident matches based on limited, incorrect or insufficient domain knowledge. AIs do not know what they do not know, nor are they very good at questioning what they have been provided. If you ask an AI to match on a particular domain and the only context you give it is the raw data set, it will not know anything outside of it. So it will not see anything wrong with matching Buicks, GMCs and Fords in the same data set of deciduous trees as the Larch, or the Larch, or the Larch (a Monty Python joke). It will not flag car brands as errors, because it does not know what a car brand is any more than it knows what a tree is. It just knows it was asked to classify data, so it will do that.
The joke carries a real point, which is that nothing in the data set was wrong by the data set's own lights; every value was a well-formed string in a well-formed column. The error lived in what the model was never told. And the sentence that followed was the one I would not soften then and will not now:
That is not an AI problem. That is a user problem — someone set the AI up to fail by not giving it enough context to understand what it did not understand.
I would push that one step further than I did at the time. A model left to itself takes whichever shortcut its objective rewards, and that is not deception, since there is no intent to police; it is optimization against whatever it was asked for. That is why the word carrying this entire cost line is enforced. A gate that is advisory is a suggestion rather than a limit, and a case booking reduced rework against an intention to review the output has booked a saving against a hope.
Most of this work is repetitive rather than difficult, which is worth saying because it prices differently. Normalizing a supplier name, classifying a part, proposing a value for a field empty since the last migration: work of that shape wants basic domain competence rather than a late-generation model, and competence of that kind is written into the prompt rather than bought in the model. The oldest failure in the trade is still the live one, and I have called it the golden hammer grown into a golden model: reaching for the largest tool on the bench because it is the largest one there.
"The model was confident" is no answer when somebody asks why two identities were fused. Asked whether a regulator, an auditor or a risk function had ever put that question to me, I refused the premise that it is a rare event to be survived:
That question is constantly asked and if you don't have a ready answer, you're in a lot of trouble and headed down a rabbit hole without a flashlight. You either pay up front as part of the build or you really pay--and you don't know how much you pay until the bill comes due--down the road.
The second sentence is the budget line, and it is unbounded by construction, because whoever asks decides how far back the answer has to reach. Pressed on what the up-front half costs, I gave a zero with a condition on it that carries the load: "In a properly scoped and implemented project, there's no additional cost because implementation is the cost you have to pay up front." Describing the mechanism behind a merge is part of building the merge, and leaving it out costs two things, only the first of which is compliance: the logic cannot be defended when it is challenged, and it cannot be changed when the requirement moves. I have never seen the item budgeted, and I think it should be, in architectural design rather than in documentation, because the flexibility lives where the implementation does. There is real work on explanations built for the semantics of entity resolution, producing saliency scores and counterfactuals showing which values would have flipped a decision [14], and that is a different artifact from the written rule an auditor asks to see.
One distinction to carry into the funding conversation, since these stall most often on an answer that is perfectly true and addressed to a question nobody asked. When a finance director asks who deserves the credit, the thing being asked is rarely fairness; it is repeatability, whether another dollar buys another unit of the same thing. Saying the engineers did it is true and settles nothing. The version that settles it: the technique lowered the price of attempting a whole class of problem, and the delivery is what turned the attempt into value, so fund the capacity and treat the model as the line that moved the threshold.
A disclosure belongs here, before I assess anyone's product. The practice behind this publication is a Profisee partner and holds a referral agreement with Profisee. Clients pay us for deployment work, and a licence sale we refer earns us a referral fee from the vendor. Beyond both, our services revenue depends on this category of software being bought at all, which is a stake in exactly the business cases this piece is about. None of the vendors whose documents and price lists I read below is Profisee. Weigh my criticisms above any praise.
One morning's price lists
The price is the other half of what can be checked, and my own advice is where the checking starts. Compressed, my cost approach came to four moves:
If you wanted to encapsulate my optimization approach: start one generation behind the current main models and two generations behind the bleeding edge. Then use the minimum token budget available per request. Focus on prompt engineering, and organically build your gates as you go, starting with what you have already developed as what your company considers basic guardrails.
Three of those are judgement, and I would put all three into a cost model without argument: the minimum viable token budget, measured rather than assumed; prompt engineering, the highest-leverage reduction on offer and a line item almost nowhere because it looks like writing; and gates grown out of what the organization already treats as its guardrails. The fourth is not judgement. Starting one generation behind is a claim about published prices, and a published price is the rare thing here that can be checked before a dollar is committed. So I checked it, on three vendors' own lists, read on one morning. They give three different answers, and the disagreement is the useful part.
| Vendor and line | Current | Going back, over the rungs sampled | Shape of the ladder |
|---|---|---|---|
| OpenAI, the base general line [16] | $10.00 / $50.00 | one back $4.00 / $20.00; two back $5.00 / $30.00; three back $2.50 / $15.00; four back $1.75 / $14.00; five and six back $1.25 / $10.00 | falls, rebounds, then descends — one back is 60% off, but two back is dearer than one |
| Anthropic, Claude Opus [17] | $5.00 / $25.00 | five consecutive versions at that same price; then the retired ones at $15.00 / $75.00 | flat, then a step up — the rule changes nothing at the rung it names; the 3× is five rungs back, at models the vendor has retired |
| Google, Gemini Flash [10] | $0.75 / $3.75 | one and two back identical; three back $1.50 / $9.00; four back $0.50 / $3.00 | zigzag — nothing, then double, then two-thirds off both sides |
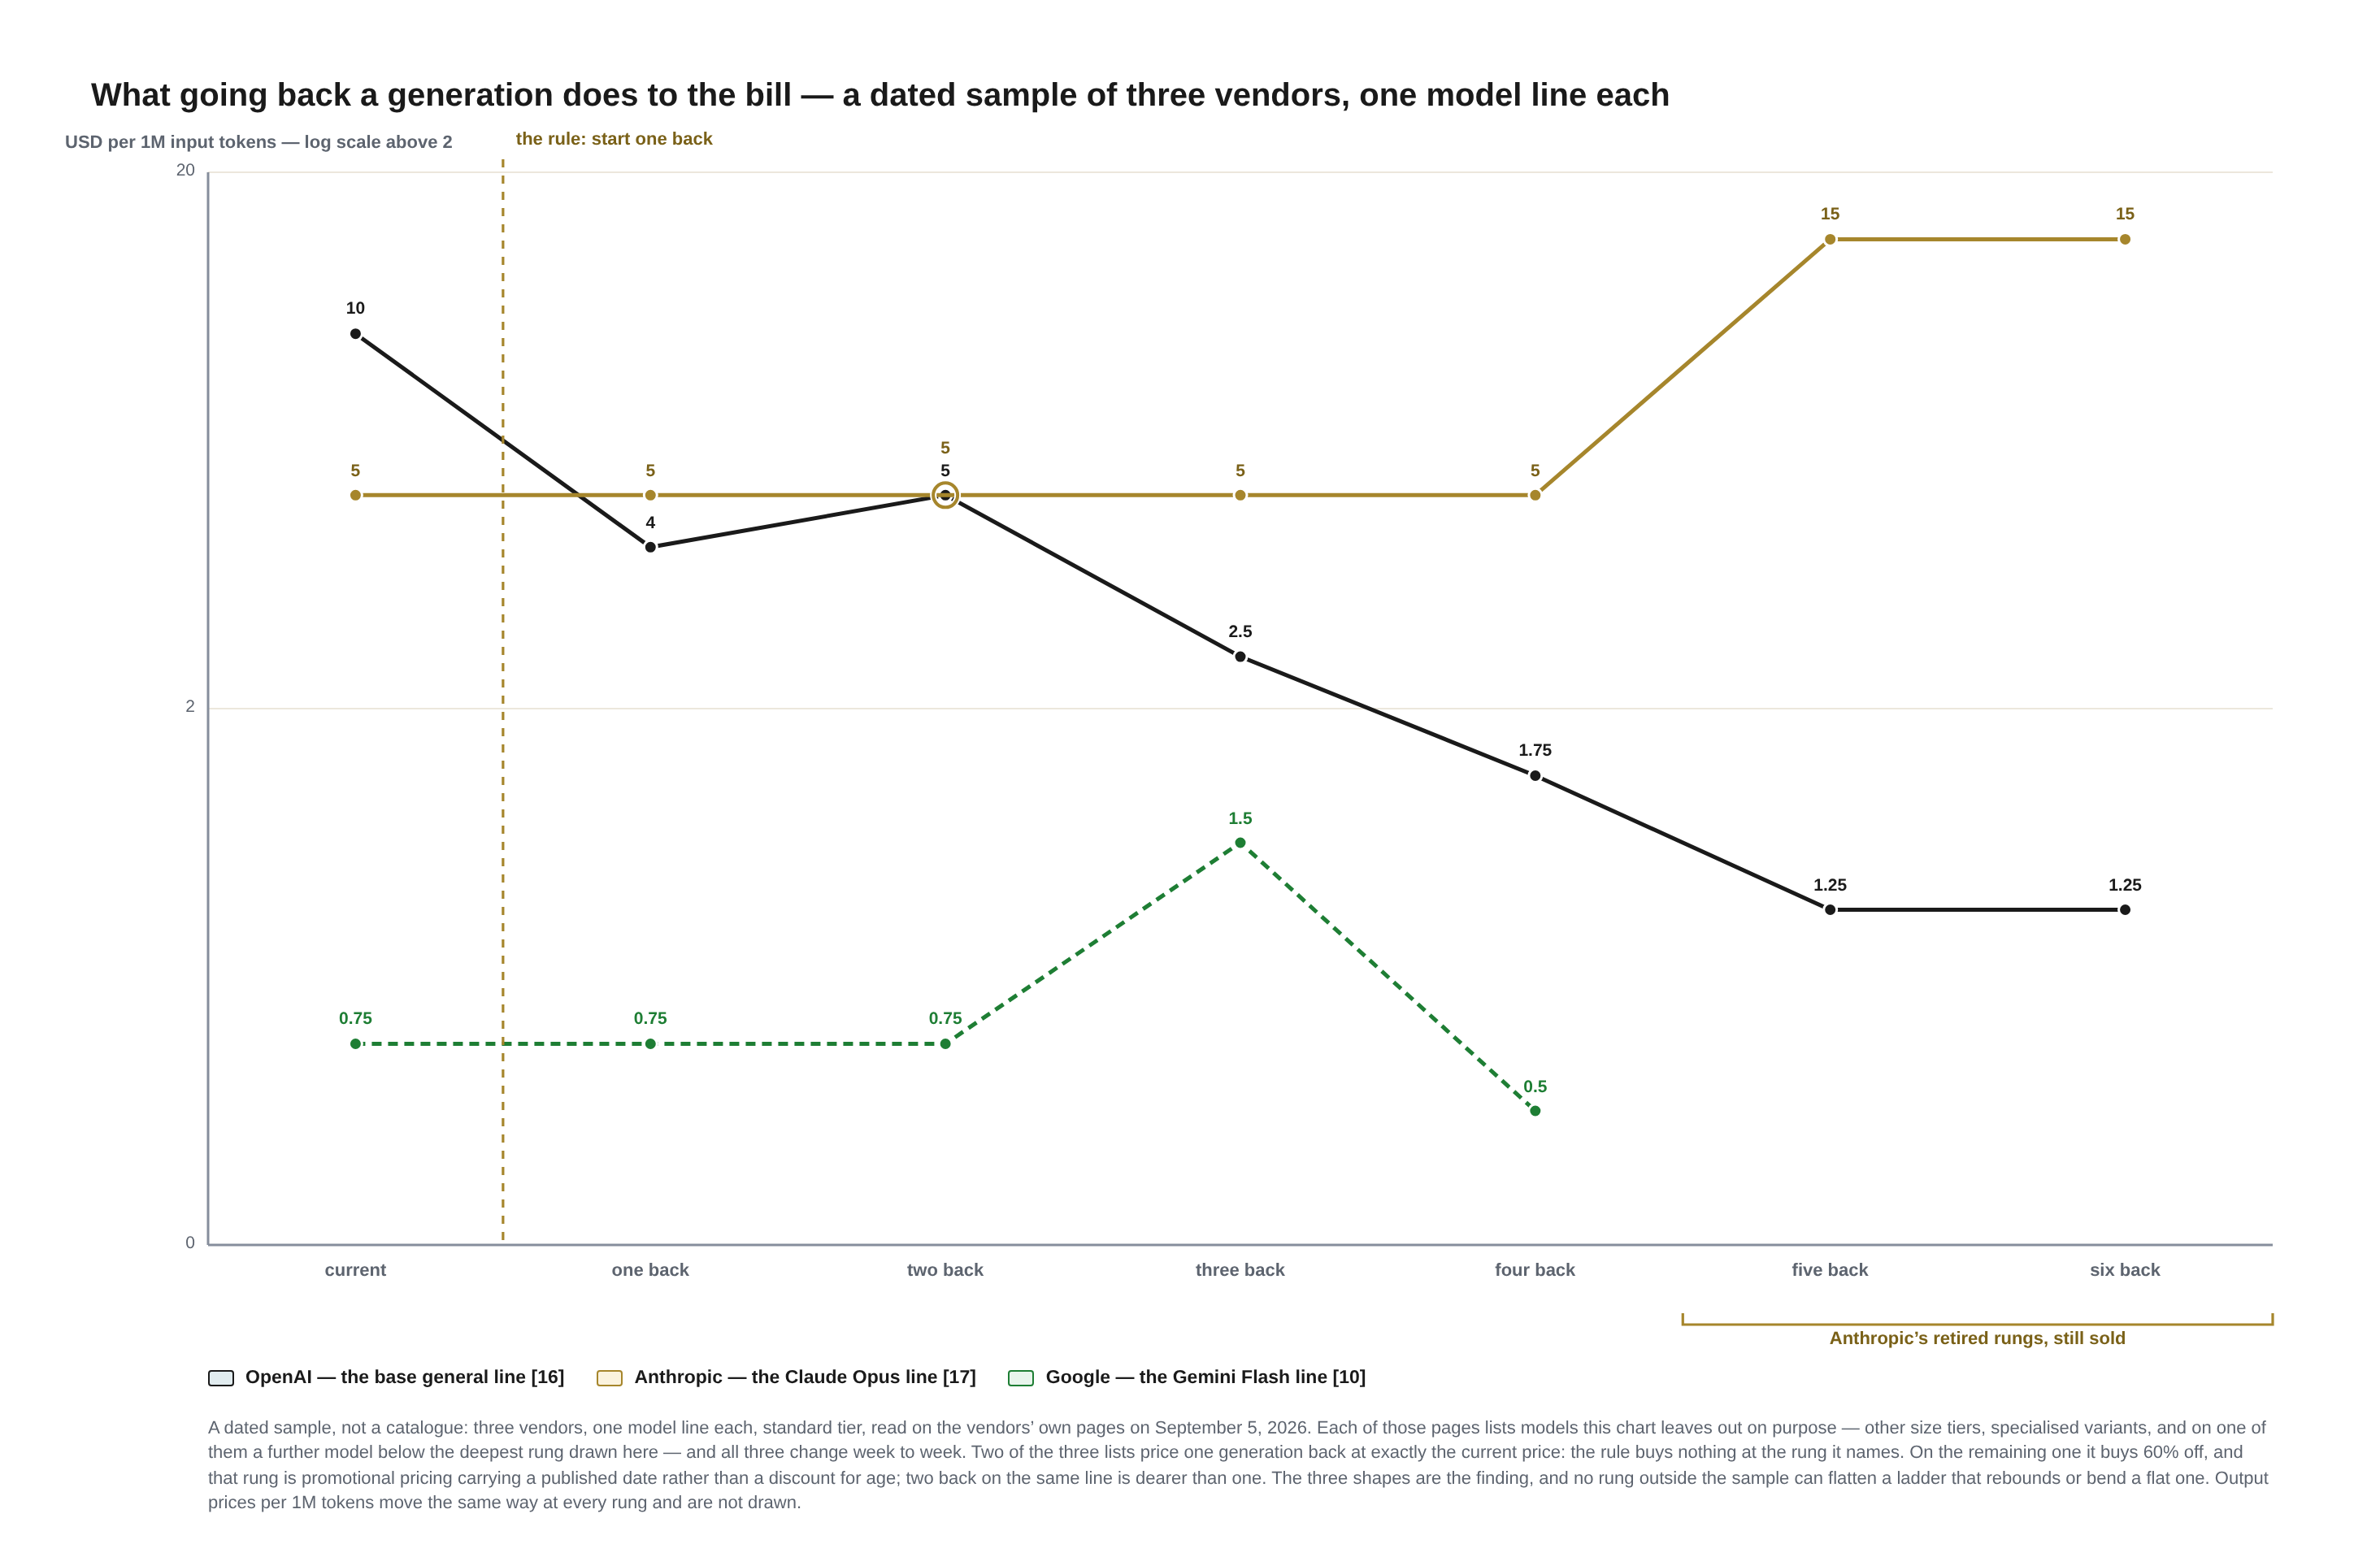
What going back a generation does to the bill — a dated sample of three vendors, one model line each. A line chart. The horizontal axis walks one model line backwards in seven steps: current, one back, two back, three back, four back, five back, six back. The vertical axis is captioned USD per 1M input tokens — log scale above 2, with gridlines at 0, 2 and 20. A dashed vertical marker stands at the first step, labelled the rule: start one back. A bracket beneath the last two steps is labelled Anthropic’s retired rungs, still sold.
Three plotted lines:
- OpenAI — the base general line [16], solid and undashed. 10 at current, falling steeply to 4 one back, back up to 5 two back, then down through 2.5 three back and 1.75 four back to 1.25 at five back and 1.25 again at six back.
- Anthropic — the Claude Opus line [17], solid gold. 5 at every one of the first five steps — current, one back, two back, three back, four back — then a step up to 15 at five back and 15 again at six back. Flat where the rule points, and three times dearer only at the far end.
- Google — the Gemini Flash line [10], dashed green. 0.75 at current, 0.75 one back and 0.75 two back, up to 1.5 three back, down to 0.5 four back. The drawn line ends there because the sample does; the vendor's page carries at least one further model below it. A zigzag: nothing, then double, then two-thirds off.
At two back the OpenAI and Anthropic markers hold the same value and are drawn as concentric rings on that value rather than nudged apart, so both 5 labels sit stacked over one point.
Beneath the plot: A dated sample, not a catalogue: three vendors, one model line each, standard tier, read on the vendors’ own pages on September 5, 2026. Each of those pages lists models this chart leaves out on purpose — other size tiers, specialised variants, and on one of them a further model below the deepest rung drawn here — and all three change week to week. Two of the three lists price one generation back at exactly the current price: the rule buys nothing at the rung it names. On the remaining one it buys 60% off, and that rung is promotional pricing carrying a published date rather than a discount for age; two back on the same line is dearer than one. The three shapes are the finding, and no rung outside the sample can flatten a ladder that rebounds or bend a flat one. Output prices per 1M tokens move the same way at every rung and are not drawn. Since this reading: on September 26, 2026 Anthropic’s current Opus is 5.5 at $4 in / $20 out, so one back (Opus 5, $5 / $25) now costs a quarter more [17] [19].
I drew that rule from a handful of price sheets that happened to follow the pattern, and it is local. On the first sheet the rung it names is sixty percent cheaper, though the next one down is dearer again; on the second it buys nothing whatever, five consecutive versions carrying one price, so that the tripling the ladder does eventually contain sits five rungs back among models the vendor has retired, a place nobody's optimization advice was pointing; on the third the answer turns on which rung you land on. The direction is not stable inside a single vendor either: on Anthropic's list the Opus tier steps up as you go back, the mid tier is one and a half times dearer a version back, and the small tier runs the other way, the retired model priced a fifth under the one that replaced it [17].
What the three lists share is structure rather than policy. Each model carries a price set on the day it shipped, so the slope anybody thinks they see across generations is a trace of what each launch happened to be priced at. Where the trace descends, going back is real money; where a vendor holds one price across a family, or ships a successor cheaper than the thing it replaced, it flattens or inverts and the rule stops forbidding anything at all. Three dated step changes belong in the model rather than in your memory of it, and they do not point the same way. Google's current rate is promotional and doubles on 2027-01-01, which brings the three-generations-back rung to the same input price as the current one, $1.50 either way, though the two do not meet on output, where the older model stays at $9.00 against the current one's $7.50, so it is parity on one side of the bill and the newer model cheaper on the other [10]. OpenAI's one-back rung is promotional too, published as holding at least until 2026-11-21, so the sixty percent the rule appears to buy on that list has no promised life beyond that date and is not a discount for age at all [16]. Anthropic went the other way and made an introductory mid-tier rate the standard price rather than raising it as scheduled [17].
The first reading I would decline is the one my own heuristic invites, which is to treat age as a dial. Nothing on these sheets is priced by age. Read that way the table becomes a recommendation to shop in the past, and on one of the three lists a recommendation to pay three times over for a model since fallen behind on instruction following, on structured output, and on current safety defaults. The older model is an option you price like any other, and the discriminator is nothing subtler than whether its row is cheaper.
The second reading runs the other way and is the more comfortable: that the ladders are incoherent and pricing therefore cannot be modeled at all. That does not follow, though the obvious defense of these numbers is the wrong one, and it is worth saying why. Being published and dated is not what makes them trustworthy. Flyvbjerg, Holm and Buhl went through 258 transportation infrastructure projects worth ninety billion dollars and found that actual costs ran 28% above the estimates decisions were taken on, understated in almost nine cases out of ten, with no improvement across seventy years of practice, a bias too one-sided to be honest error and, on their reading, best explained as strategic misrepresentation [18]. Those estimates were published and dated too, which is why the remedy they propose is penalties rather than more disclosure. What separates a vendor's price list from a business case is not provenance but recourse: this is the rate you are billed at, you can hold the vendor to it, and when it moves you read it again and decide again. Nobody is ever billed for a wrong line in your own cost model, and that is precisely why that line is the one to distrust. What is unstable here is the generalization somebody laid over the top of the prices, not the prices. A number that moves is not a number you cannot have; put the read date beside it and the instability becomes a maintenance item rather than an excuse.
The table makes no claim to be complete, and deliberately. A table claiming every priced rung, against pages that ship new models weekly, goes false on its own, on the vendor's schedule, with nobody at fault. What is above is three lines, one morning, dated and openly partial, because the question underneath never needed a census: whether price falls as you walk one line backwards is settled by the rungs you did read. The claim that would need a census is the one I am not making, which is that this is what the market charges. What does not go away is the expiry. Between an August reading and the September one in the table, the top OpenAI line gained a model above it and repriced two rungs, Google's ladder slid a step deeper, and Anthropic's did not move at all.
Less than three weeks later it moved under me, in the pipeline I was running, and I said so at the time:
I'm literally running into the whole 'model changed out from under your production pipeline with a more expensive model--in tokens and in cost' right now. Anthropic just decommissioned Opus 5.1 and replaced it with Opus 5.5, dropped me from High to Medium and increased my capacity usage. I've used Claude less this week than 'normal' and eaten up more of my allocation than my previous trend.
The vendor's list has no Opus 5.1, and its page for 5.5 compares it only with Opus 5, which is still listed and still sold. The page does bear out the mechanism, and it is worth reading closely because its rate card points the other way. Opus 5.5 is listed at $4 per million input tokens and $20 per million output, below Opus 5's $5 and $25; the default effort is now medium where Opus 5 ran at high; and at the same effort setting the new model "tends to think more per turn" [19]. The price per token fell and the tokens per result rose, so the price list says the same work got cheaper while the allocation said it got dearer. The page names no retirement date, so the decommissioning is my account rather than the vendor's, and the trend I measured it against is my own impression rather than a log: one account's week, not a measurement. It is still the whole of this section in miniature. Read today, with Opus 5.5 current at $4 and $20 and Opus 5 still listed at $5 and $25 [17], my rule costs a quarter more at the rung it names on the one list where, three weeks earlier, it had cost nothing either way.
The third reading is the one an eager reader reaches first, because the tier spread is the largest number on the page. Same generation and same launch day, OpenAI's large variant runs $4.00 in and $20.00 out against $0.20 and $1.20 for its small one, twenty times on input and nearly seventeen on output [16]; Anthropic's current family spans ten times [17]; Google prices Pro, Flash and Flash-Lite separately and runs twenty times on input and thirty on output across its sellable list [10]; Microsoft's catalog shows the same shape as a product structure, a mini, a nano, a standard and a pro inside one series [9]. The saving is in the tier, and unlike vintage it behaves the same way on all three sheets. One caveat, the ordinary one: three lists, one morning. Read your own rows, on your own vendor, and date them.
A multiple is not a decision, though, and the price list holds no opinion on what decides it: how long and how strange the tail of your records is, whether anybody exists to staff the queue a smaller model will fill, whether the source data is even present to give it context. A cheaper model pushing twice as many records into a clerical queue you cannot staff has saved nothing; it has moved the cost onto a line the price list does not print. Which option bites depends on the shape of your data, so I will not rank them. When the size lever came up, I declined to rank that too:
Intentionally "smaller" or "cheaper" current generation models are viable too. They're options to be considered in addition to older generation models. Your mileage (and token efficiency) may vary and really can only be guessed at without empirical tests.
That refusal is a method, not a hedge, and a published benchmark will not replace it, because contamination inflates the score: where rephrased test data survives into training, a 13-billion-parameter model has been shown reaching drastically high performance, on par with GPT-4 [11]. So the line item is a bake-off: a few thousand of your own records, labeled once, run through a frontier model as the ceiling, the generation behind it, and one or two small current models, scored against the same labels and divided by what each cost at the price published the week you ran it. The bake-off on top of that labeled set is cheap; the labels never are. Which makes the implication blunt enough to say once: a return computed at frontier prices is a fact about a procurement decision, not about the technique.
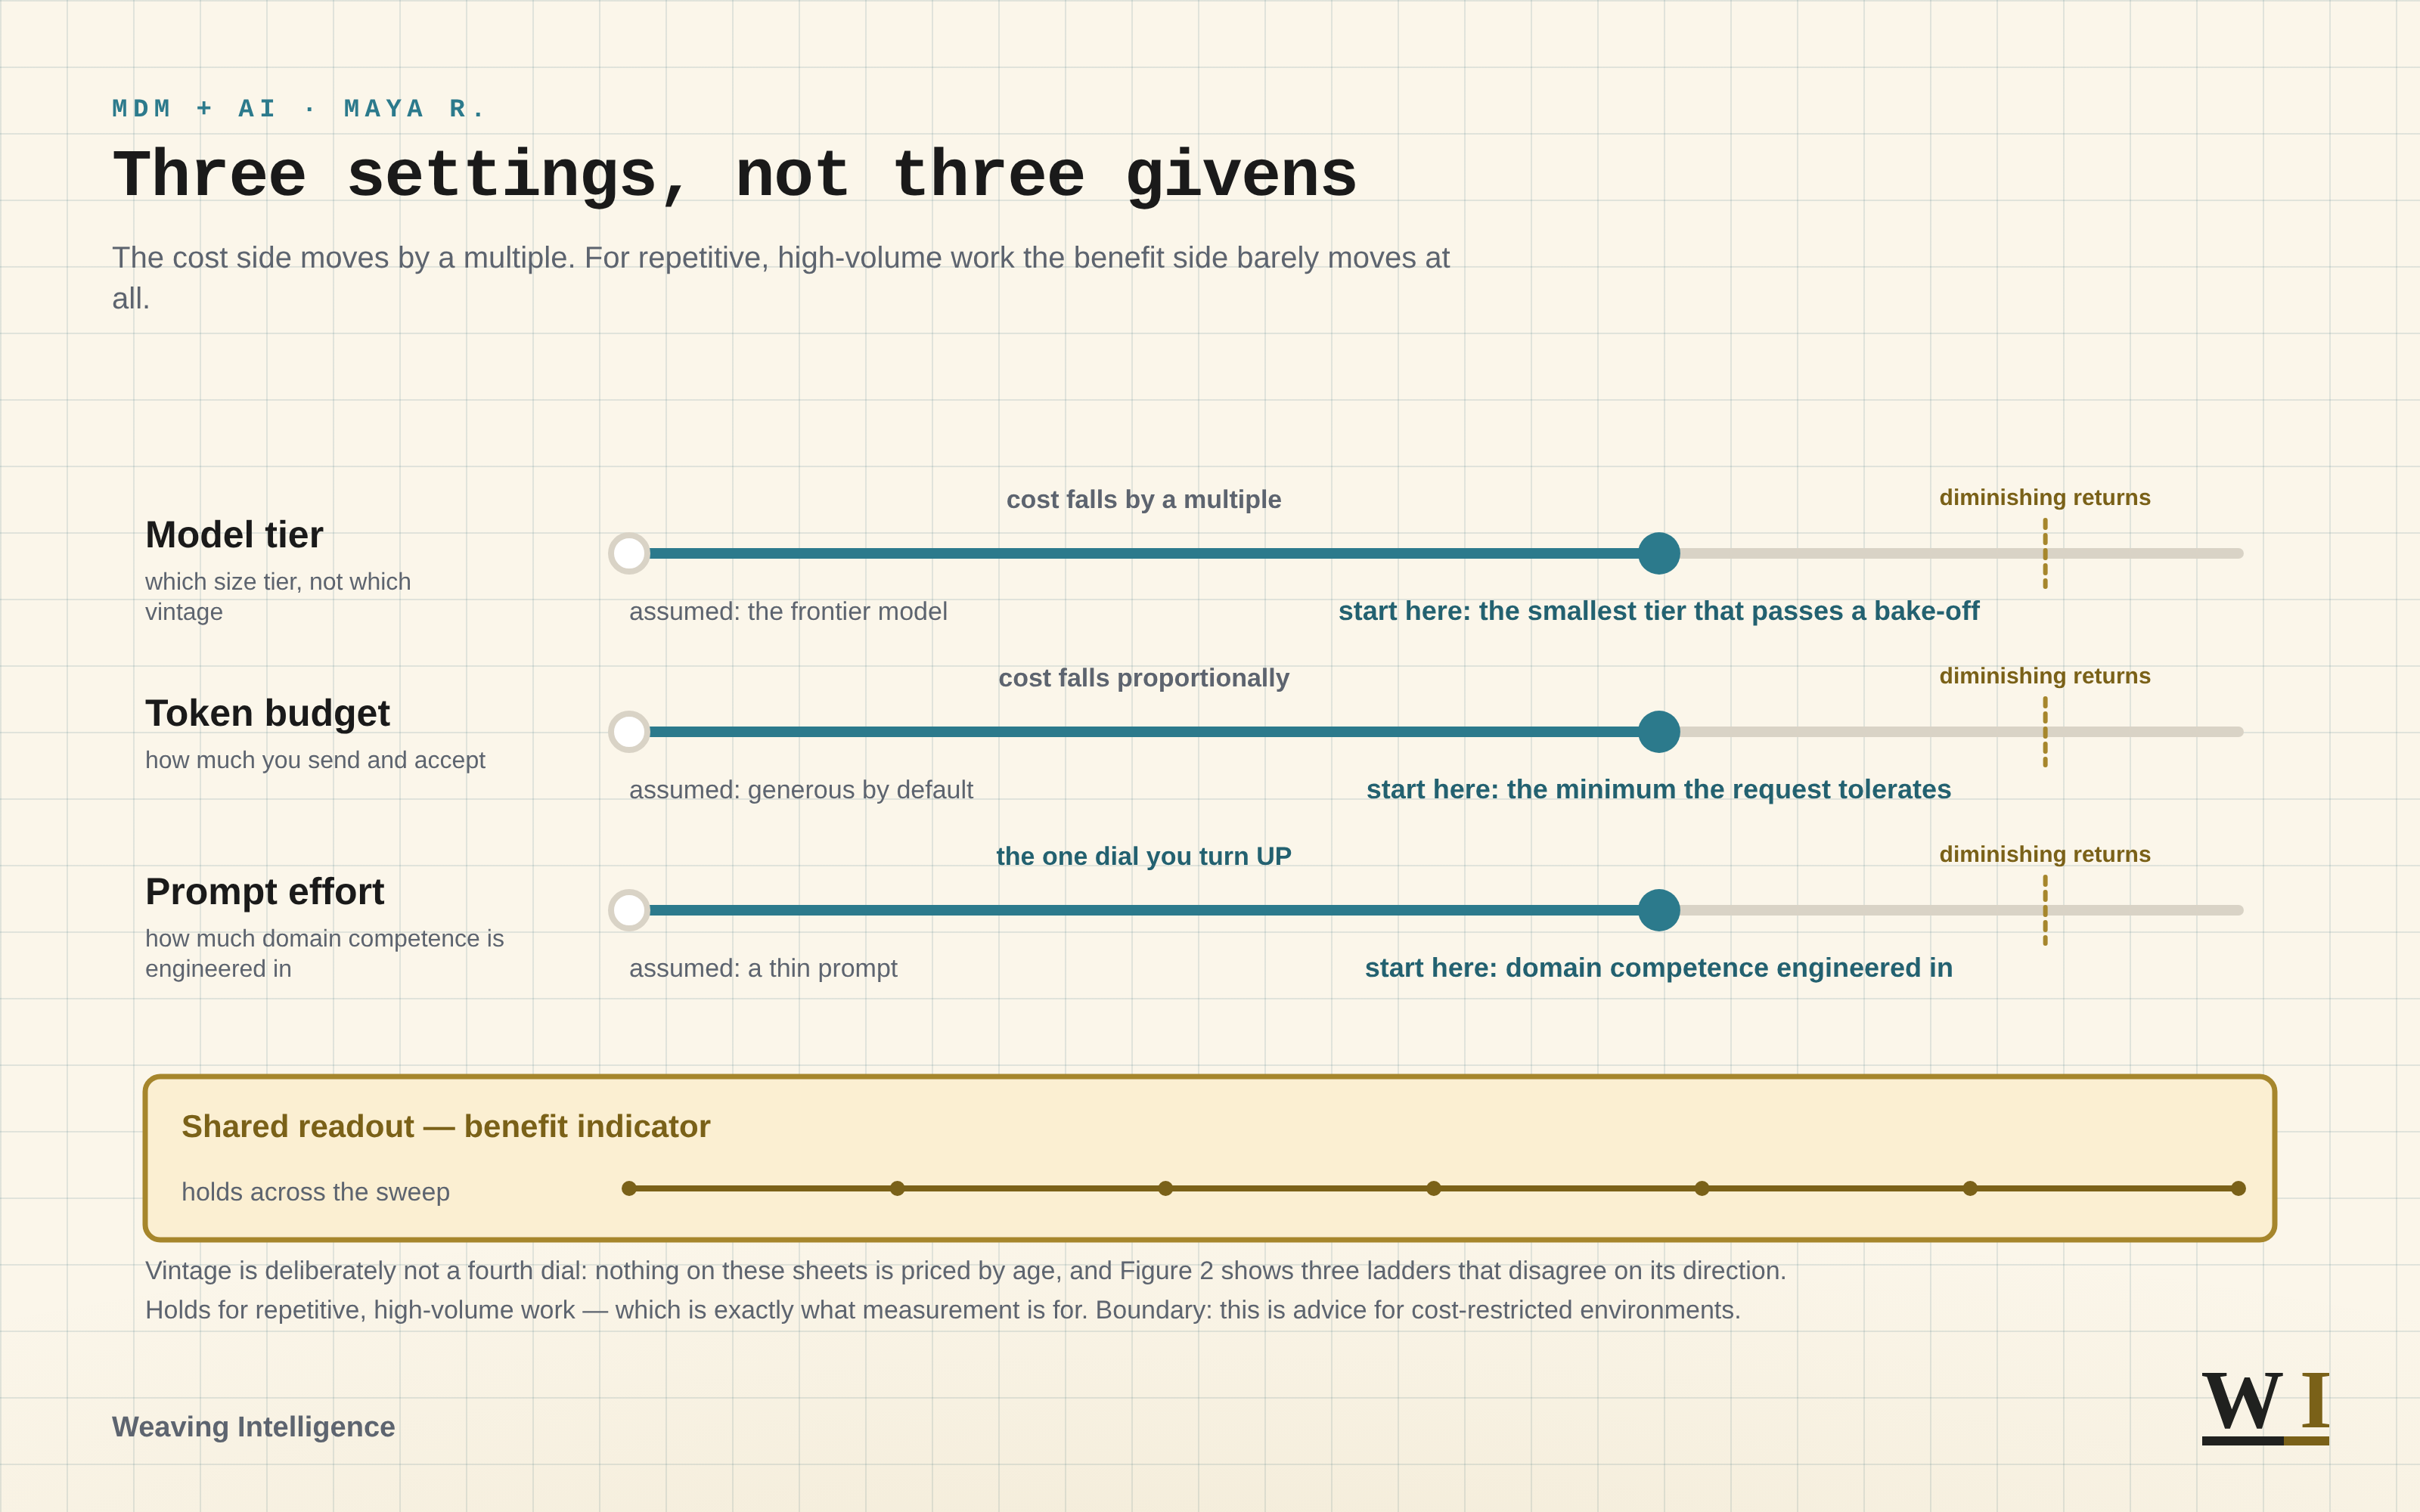
Three settings, not three givens. The cost side moves by a multiple. For repetitive, high-volume work the benefit side barely moves at all.
Three tracks run in parallel. On each, a hollow marker at the far left is what the deck assumes, a filled teal marker about two thirds along is where to start, and the teal bar between them is the move being recommended, labelled above with what that move does. Past the filled marker the track continues in grey.
- Model tier — which size tier, not which vintage. Over the bar, cost falls by a multiple. Assumed: the frontier model. Start here: the smallest tier that passes a bake-off.
- Token budget, how much you send and accept. Over the bar, cost falls proportionally. Assumed: generous by default. Start here: the minimum the request tolerates.
- Prompt effort, how much domain competence is engineered in. Over the bar, the one dial you turn UP — the only one of the three the piece asks you to increase. Assumed: a thin prompt. Start here: domain competence engineered in.
A gold band beneath the three carries the Shared readout — benefit indicator, which holds across the sweep: a line of evenly spaced points crossing the same span the dials do, level from end to end. Two lines run under the band. Vintage is deliberately not a fourth dial: nothing on these sheets is priced by age, and Figure 2 shows three ladders that disagree on its direction. Then: Holds for repetitive, high-volume work — which is exactly what measurement is for. Boundary: this is advice for cost-restricted environments.
The most expensive slide in circulation still points a model at a mess, calls the mess ready because the deck looks tidy, and ships the errors faster. Gartner's own numbers put a scale on it: 63% of organizations lack, or are unsure they have, the data management practices their AI work needs, and Gartner predicts that through 2026 organizations will abandon 60% of AI projects unsupported by AI-ready data [12]. Read that as a cost forecast rather than a warning. If it holds, a pilot pointed at an ungoverned estate is paid for and the mess is kept, which makes the governed layer less a precondition to the business case than a large uncredited share of the return inside it. The companion prediction is at least the kind that can be marked: in 2024 Gartner held that at least 30% of generative AI (GenAI) projects will be abandoned after proof of concept by the end of 2025, due to poor data quality, inadequate risk controls, escalating costs or unclear business value [13]. That horizon has passed and I have no independent measurement of how it landed, which is still the difference between it and a vendor's slide. Prefer a forecast with an expiry date.
Every price above understates, and one correction earns its place before the lines are gathered: a unit price is not a bill. The cheap classify call rarely stays a classify call, since the confidence band, the second pass, the explanation and the routing turn one request into five, and I have just spent a section asking for every one of them. The effort default above is the same thing done by the vendor rather than by you. So cost the workflow you end up with rather than the call you start with. The lines I would put in the model first, gathered so nobody has to reassemble them: the platform build; the temporary architecture; the wait for provisioning; defining the output standard; continuous source access; the labeled set; and the clerical review queue. Seven, and explainability is deliberately not the eighth, because it is not a line you add but a property of how the platform build is done. The rule I have applied to everybody else applies here too: nobody gets a number that has not been measured, and this piece has sized exactly one of the seven, in records rather than money.
What I would watch for
Everything above is argued from sources, with my own answers set against them; what follows is judgement, the ways I would expect a case of this kind to go wrong, offered as patterns to look for rather than findings I can hand you.
- The vendor-commissioned return study. The Total Economic Impact genre wants the most care, and its problem is not dishonesty, it is selection: the vendor commissions the study and the analyst interviews customers the vendor nominated, which by construction is the set for whom it worked. The mechanism described is usually sound. The number attached is a ceiling somebody was paid to find, and the discriminator is who drew the population.
- A case standing on one figure. Where the only thing holding a request up is a payback month, ask what becomes of it when the sponsor changes, when the integration team is booked out, or when the cash is not there. A figure is one input among several and has never been the only thing in the room.
- The one-time install. Thresholds want re-tuning, labeled sets want maintaining, and somebody has to watch precision and recall so a quiet regression does not become next year's incident. The vendor's calendar belongs on the same list: the model under the pipeline will change, and the cost per result changes with it. Budget the feeding as well as the purchase.
- A benefit with no baseline. A before that is a guess and an after that is a demo. Capture steward hours per thousand records, duplicate and survivorship error rates, and the downstream cost of one bad record, all three before a vendor is near the estate.
Where to Go Deeper
Whose work I would actually read on this, rather than whose deck:
- Ivan Fellegi and Alan Sunter, A Theory for Record Linkage (1969) [8]. Still the clearest account of why matching is a decision under uncertainty with two error types you trade between.
- William Winkler, Overview of Record Linkage and Current Research Directions (U.S. Census Bureau, 2006) [7]. Free, and the most useful thirty pages in the subject: the Fellegi–Sunter rule in implementable form.
- Peter Christen, Data Matching (Springer, 2012) [15]. The standard practitioner reference; read his treatment of evaluation before writing a matching requirement.
- Teofili, Firmani, Koudas, Martello, Merialdo and Srivastava, Effective Explanations for Entity Resolution Models (2022) [14]. The best pointer for turning explainability into a specification somebody can be held to.
- The cloud vendors' own accuracy-measurement guidance, of which the AWS Entity Resolution write-up is a fair representative [6]. Read it for the discipline rather than the product.
Whom I would not point you at is an authority on the economics of this, because I do not believe an honest one exists yet. The techniques are documented and in places forty years old; the cost models are barely two years old and the ladders move weekly. Measure it on your own estate, and date the page you measured it from.
What the number is for
The good news is real and belongs down here rather than at the top: this case is stronger than it was five years ago, and work that was structurally unaffordable has become cheap enough to attempt. My own reading of why is narrower than the enthusiasm around it. I do not think these models let a company do anything it could not do before. What they do is cut the price of things it already could, sometimes so far that from where the buyer sits the cut is indistinguishable from a new capability. That is a reason to build the case on the price, which can be checked, and not on the capability, which is a feeling.
None of this is an argument against numbers. It is an argument about which question a number was cut to answer. A price list answers what the call costs today, and it answers that well. A reference-customer survey answers whether the category is expensive, and it answers that too. Neither answers what your estate will return, and every figure in a business case was offered because it is the one that could be read in the room, in the light available, by people who have never run the thing. So when the next figure is set down in front of you, is the thing you want to know whether it is high, or which question it was cut to answer, and whether anybody in the room has quietly asked it a second one?
An earlier version of this piece — written before this publication rebuilt how its voices are generated — is published unedited at Costing the Promise: The Parts of an AI-MDM Business Case You Can Actually Check (original), so the two can be read side by side. The account of why is at The Voice Problem.
References
[1] Gartner, Data Quality: Why It Matters and How to Achieve It (topic overview), citing Gartner research that poor data quality costs organizations an average of at least $12.9 million a year. The topic page does not disclose the population behind the figure. It traces to Gartner's Magic Quadrant for Data Quality Solutions (Melody Chien and Ankush Jain, July 27, 2020, Gartner document 3988016), which attributes the $12.9 million to its own "Magic Quadrant customer reference survey" and, in its evidence section, describes that survey as a web-based questionnaire sent to "reference customers identified by each vendor", with "154 organizations associated with 16 vendors" providing input. Both sentences were read in a publicly posted copy of the report on September 4, 2026; the population figure appears in the Magic Quadrant, not on the topic page linked here. Cited as evidence that the category is expensive, never as a measurement. https://www.gartner.com/en/data-analytics/topics/data-quality
[2] Amazon Web Services, Your cloud transformation journey — An Overview of the AWS Cloud Adoption Framework — the four phases Envision, Align, Launch and Scale; Launch "focuses on delivering pilot initiatives in production and on demonstrating incremental business value," Scale on "expanding production pilots and business value to desired scale." https://docs.aws.amazon.com/whitepapers/latest/overview-aws-cloud-adoption-framework/your-cloud-transformation-journey.html
[3] ISO/IEC/IEEE 12207:2026, Systems and software engineering — Software life cycle processes, edition 2, published April 2026 — the standard states that it "does not identify or require any specific software life cycle model, development methodology, method, modelling approach, or techniques for selecting a life cycle model," and that its processes may be applied "concurrently, iteratively, and recursively." Quoted from the publicly readable ISO abstract; the normative text is behind ISO's paywall and was not consulted. Catalogue page re-read September 26, 2026 (publication date given as April 29, 2026). https://www.iso.org/standard/90219.html
[4] Gartner press release, Gartner Predicts by 2028, 80% of GenAI Business Apps Will Be Developed on Existing Data Management Platforms (June 2, 2025). https://www.gartner.com/en/newsroom/press-releases/2025-06-02-gartner-predicts-by-2028-80-percent-of-genai-business-apps-will-be-developed-on-existing-data-management-platforms
[5] Google, Classification: Accuracy, recall, precision, and related metrics, Machine Learning Crash Course — "precision and recall often show an inverse relationship, where improving one of them worsens the other"; metric choice "depend[s] on the costs, benefits, and risks of the specific problem." https://developers.google.com/machine-learning/crash-course/classification/accuracy-precision-recall
[6] Travis Barnes and Yefan Tao, Amazon Web Services, Measuring the accuracy of rule or ML-based matching in AWS Entity Resolution (September 29, 2025) — manually annotated ground-truth sets, precision, recall and F1; the industry asymmetry (healthcare favouring precision, advertising favouring recall); and why 100% accuracy is not achievable at real-world volumes. https://aws.amazon.com/blogs/industries/measuring-the-accuracy-of-rule-or-ml-based-matching-in-aws-entity-resolution/
[7] William E. Winkler, Overview of Record Linkage and Current Research Directions, U.S. Census Bureau Research Report Series (Statistics #2006-2), February 8, 2006 — §3.1 states the Fellegi–Sunter decision rule in three regions, names the middle band the "clerical review region," and notes that the cutoff thresholds "are determined by a priori error bounds on false matches and false nonmatches." Free full text. https://www.census.gov/content/dam/Census/library/working-papers/2006/adrm/rrs2006-02.pdf
[8] Ivan P. Fellegi and Alan B. Sunter, A Theory for Record Linkage, Journal of the American Statistical Association, Vol. 64, No. 328 (December 1969), pp. 1183–1210. DOI 10.1080/01621459.1969.10501049. Full text is paywalled and no free copy on a government or university host could be located; I have read it only through the secondary literature, chiefly [7]. The publisher page answered a fetch with 403 on September 26, 2026; the DOI is the stable identifier. https://www.tandfonline.com/doi/abs/10.1080/01621459.1969.10501049
[9] Microsoft, Foundry Models sold directly by Azure (Microsoft Learn) — vendor documentation that a single current model series ships as distinct size tiers; the GPT-5.4 series is listed as "gpt-5.4-mini, gpt-5.4-nano, gpt-5.4, gpt-5.4-pro." Cited for what the product lineup is, not as a recommendation; verified August 17, 2026 and again September 26, 2026 (page updated September 23, 2026), and this catalogue changes frequently. https://learn.microsoft.com/en-us/azure/foundry/foundry-models/concepts/models-sold-directly-by-azure
[10] Google, Gemini Developer API pricing — per-model tables headed "Paid Tier, per 1M tokens in USD," carrying separately priced Pro, Flash and Flash-Lite variants within the same model generation. Cited for the structure of the price ladder and for the standard paid-tier figures quoted in the text, read at this page on September 5, 2026 (earlier readings August 18 and September 4). The vintage ladder in the table walks the Flash line only, rung by rung: $0.75 in / $3.75 out for the current Flash generation (gemini-3.8-flash) and for the two behind it (gemini-3.7-flash, gemini-3.6-flash); $1.50 / $9.00 three generations back (gemini-3.5-flash); and $0.50 / $3.00 four generations back, the model the page labels "our legacy Flash model" (gemini-3-flash-preview). At the August reading gemini-3.8-flash had not yet shipped, so each of those rungs then sat one step shallower; no price on the ladder changed between the readings, only its depth. The tier spread quoted separately in the text is a different axis and is not part of that ladder: $2.00 / $12.00 for the current Pro at prompts of 200k tokens or under (gemini-3.1-pro-preview) against $0.30 / $2.50 for the current Flash-Lite (gemini-3.5-flash-lite), and $0.10 / $0.40 for the cheapest sellable model on the page (gemini-2.5-flash-lite), which is what makes the spread twenty times on input and thirty on output. The page carries a promotional note that $0.75 / $3.75 runs "through December 31, 2026" before rising to $1.50 / $7.50; gemini-3.5-flash carries no such note and is listed at a flat $1.50 / $9.00, so on January 1, 2027 the current rung and the three-back rung meet at the same input price. They do not meet on output: the current rung rises to $7.50 while gemini-3.5-flash stays at $9.00, so that parity holds on input alone and the newer model stays the cheaper of the two on output. What this ladder deliberately omits. The Flash line continues below the deepest rung walked above — gemini-2.5-flash is listed on the same page at $0.30 in / $2.50 out for text, image and video input, $1.00 for audio. It is outside the sample rather than missed from it: five rungs are enough to establish the ladder's shape, and a sixth at $0.30 would deepen the zigzag rather than smooth it. Model names and prices on this page change frequently — re-read it before relying on any figure above. https://ai.google.dev/gemini-api/docs/pricing
[11] Shuo Yang, Wei-Lin Chiang, Lianmin Zheng, Joseph E. Gonzalez and Ion Stoica, Rethinking Benchmark and Contamination for Language Models with Rephrased Samples, arXiv:2311.04850 (2023) — demonstrates that when rephrased variants of test data survive in training, "a 13B model can easily overfit a test benchmark and achieve drastically high performance, on par with GPT-4." https://arxiv.org/abs/2311.04850
[12] Gartner press release, Lack of AI-Ready Data Puts AI Projects at Risk (February 26, 2025) — 63% of organizations lack or are unsure of AI-ready data practices; prediction that organizations will abandon 60% of AI projects unsupported by AI-ready data through 2026. https://www.gartner.com/en/newsroom/press-releases/2025-02-26-lack-of-ai-ready-data-puts-ai-projects-at-risk
[13] Gartner press release, Gartner Predicts 30% of Generative AI Projects Will Be Abandoned After Proof of Concept By End of 2025 (July 29, 2024) — "at least 30% of generative AI (GenAI) projects will be abandoned after proof of concept by the end of 2025, due to poor data quality, inadequate risk controls, escalating costs or unclear business value"; deployment costs of $5M–$20M; and a survey of 822 business leaders conducted September–November 2023 in which respondents self-reported average gains of 15.8% revenue, 15.2% cost savings and 22.6% productivity. https://www.gartner.com/en/newsroom/press-releases/2024-07-29-gartner-predicts-30-percent-of-generative-ai-projects-will-be-abandoned-after-proof-of-concept-by-end-of-2025
[14] Teofili, Firmani, Koudas, Martello, Merialdo, and Srivastava, Effective Explanations for Entity Resolution Models, arXiv:2203.12978 (2022; the title is that of version 1, and a later version is retitled CERTA: An Approach to Generate Explainable Entity Resolution Decisions) — explanation methods (CERTA) built for the semantics of entity resolution, producing saliency and counterfactual explanations used to assess trust, surface bias, and debug matches. https://arxiv.org/abs/2203.12978
[15] Peter Christen, Data Matching: Concepts and Techniques for Record Linkage, Entity Resolution, and Duplicate Detection, Springer (Data-Centric Systems and Applications series), 2012. DOI 10.1007/978-3-642-31164-2. Publisher page verified live; the text itself is paywalled. https://link.springer.com/book/10.1007/978-3-642-31164-2
[16] OpenAI, Pricing (OpenAI API documentation) — the "Standard pricing data" table, prices per 1M tokens, short-context column, read September 5, 2026. The vintage ladder in the table walks the top general model rung by rung: gpt-6-astra at $10.00 in / $50.00 out for the current generation; gpt-5.6-sol at $4.00 / $20.00 one back; gpt-5.5 at $5.00 / $30.00 two back; gpt-5.4 at $2.50 / $15.00 three back; gpt-5.2 at $1.75 / $14.00 four back; and gpt-5.1 and gpt-5 both at $1.25 / $10.00 at five and six back. The same-generation size spread quoted separately in the text is a different axis and is not part of that ladder: within the 5.6 generation, gpt-5.6-sol at $4.00 / $20.00 against gpt-5.6-luna at $0.20 / $1.20. The page states that "GPT-5.6 Sol's promotional pricing is available at least through November 21, 2026" — a floor rather than an expiry date, and quoted here as one. What this ladder deliberately omits. The page carries separate tables for specialised models, and none of their rows belong on a general vintage ladder: gpt-5.3-codex at $1.75 / $14.00 is a Codex coding model priced identically to gpt-5.2, which makes it easy to mistake for a rung; gpt-5.6-cyber at $12.50 / $75.00 is a security model and is priced above gpt-6-astra, which is why the table above calls this the base general line — a description of which rows are sampled (the plain models, not -pro, -mini or -nano) rather than a rank — "flagship" is a claim about the whole catalogue and this reading does not support one; and gpt-5.6-terra at $2.00 / $12.00 is a size tier inside the current generation rather than a generation behind it. Nor are the -pro rows on the sampled ladder, and they are the reason the label reads base: gpt-5.5-pro and gpt-5.4-pro at $30.00 / $180.00, gpt-5.2-pro at $21.00 / $168.00 and gpt-5-pro at $15.00 / $120.00 are general-purpose models priced above the sampled rung at four of its seven steps. Walking the -pro line instead does not rescue the heuristic either — it rebounds harder, $4.00 to $30.00 — but the sampled line is the plain one, and saying so is cheaper than implying a rank. An earlier reading of this page, cited when this article first ran, missed gpt-5.2; the table rests on the September 5 reading and is presented as a partial, dated sample, with what it leaves out named here and at [10]. Cited for the vendor's own published prices, never as a recommendation. This page changes frequently — re-read it before relying on any figure above. https://developers.openai.com/api/docs/pricing
[17] Anthropic, Pricing (Claude Platform documentation) — the "Model pricing" table, USD per million tokens, read September 5, 2026; every figure below was unchanged from the August 18, 2026 reading, and this is the one of the three lists that did not move between them. Figures quoted above: Claude Opus 5, 4.8, 4.7, 4.6 and 4.5 all at $5 in / $25 out, against Opus 4.1, marked retired except on Bedrock and Google Cloud, and Opus 4, marked retired except on Google Cloud, both at $15 / $75; Sonnet 5 at $2 / $10 against Sonnet 4.6, 4.5 and 4 at $3 / $15; Haiku 4.5 at $1 / $5 against the retired Haiku 3.5 at $0.80 / $4; and Claude Fable 5.1 at $10 / $50 as the top of the current family. The page also states that Sonnet 5's introductory $2 / $10 "is now the standard price" and that "the previously scheduled increase to $3/$15 per million input/output tokens on September 1, 2026 will not occur." Re-read September 26, 2026, for the text after the table: Claude Opus 5.5 is now listed at $4 in / $20 out, with Opus 5, 4.8, 4.7, 4.6 and 4.5 still listed at $5 / $25 and Opus 4.1 and Opus 4 at $15 / $75; the table itself keeps the September 5 reading. Cited for the vendor's own published prices, never as a recommendation. https://platform.claude.com/docs/en/about-claude/pricing
[18] Bent Flyvbjerg, Mette K. Skamris Holm and Søren L. Buhl, Underestimating Costs in Public Works Projects: Error or Lie?, Journal of the American Planning Association, Vol. 68, No. 3 (Summer 2002), pp. 279–295. DOI 10.1080/01944360208976273. Author accepted manuscript read in full at arXiv:1303.6604 on September 5, 2026. The sample is 258 transportation infrastructure projects worth approximately $90 billion, completed between 1927 and 1998 across 20 countries. Figures quoted above: costs are underestimated in almost 9 out of 10 projects (86% likelihood for a randomly selected project); actual costs are on average 28% higher than estimated (sd=39); the thesis that overestimation is as common as underestimation is rejected at p<0.001. On the seventy-year point the paper states that "cost underestimation has not decreased over the past 70 years" and that "no learning that would improve cost estimate accura[c]y seems to take place." The authors reject technical and psychological ("appraisal optimism") explanations on the grounds that honest error would produce a distribution centred on zero and would improve with practice, and conclude that underestimation "cannot be explained by error and seems to be best explained by strategic misrepresentation, i.e., lying." Cited above for the general finding that published, dated cost estimates can be systematically biased, and for the authors' own remedy — "financial, professional, or even criminal penalties for consistent or foreseeable estimation errors" rather than further disclosure — which is the basis for the distinction drawn in the text between provenance and recourse. The authors are explicit that their data cannot decide whether private projects perform better or worse than public ones; no claim above rests on that. https://arxiv.org/abs/1303.6604
[19] Anthropic, What's new in Claude Opus 5.5 (Claude Platform documentation), read September 26, 2026 — "Claude Opus 5.5 costs $4 USD per million input tokens and $20 USD per million output tokens, below Claude Opus 5's $5 and $25"; "The default effort is medium. A request that omits effort runs at medium; on Claude Opus 5 it ran at high"; and "At the same effort setting the model tends to think more per turn than Claude Opus 5, most of all at xhigh and max." The page gives no retirement date for any earlier model. Cited for the vendor's own statement of the mechanism, not as a measurement of anyone's bill. https://platform.claude.com/docs/en/models/opus-5-5/whats-new-opus-5-5